Use the Smith Decomposition to Analyze a Lattice
Consider the lattice  generated by integer multiples of the vectors
  and
and  .
.
In[1]:=
b1 = {3, -3};
b2 = {2, 1};
In[2]:=
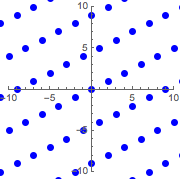
ptsb = Flatten[Table[j b1 + k b2, {j, -12, 12}, {k, -12, 12}], 1];In[3]:=
graphicsb =
 Graphics[{Blue, PointSize[Large], Point@ptsb}, PlotRange -> 10,
  Axes -> True]
Out[3]=
Let  be the matrix whose rows are
  and
and  .
.
In[4]:=
m = {b1, b2};The Smith decomposition gives three matrices that satisfy the identity  .
.
In[5]:=
{u, r, v} = SmithDecomposition[m];In[6]:=
u.m.v == rOut[6]=
The matrices  and
and  have integer entries and determinant one.
In[7]:=
{u // MatrixForm, v // MatrixForm, Det[u], Det[v]}Out[7]=
The matrix  is integer and diagonal. From its entries it can be seen that the structure of the group
  is
is  or simply
  , as
, as  is the trivial group.
In[8]:=
r // MatrixFormOut[8]//MatrixForm=
Multiplying the identity  on the right by
  gives
gives  . Because
  is integer and determinant
  ,
,  generates the same lattice as
  but is simpler.
In[9]:=
g = r.Inverse[v];
g // MatrixForm
Out[9]//MatrixForm=
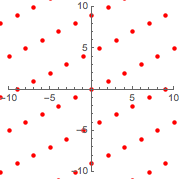
Visualize the lattice generated by the rows of  .
.
In[10]:=
ptsg = Flatten[
   Table[j First[g] + k Last[g], {j, -12, 12}, {k, -12, 12}], 1];
In[11]:=
graphicsg =
 Graphics[{Red, PointSize[Medium], Point@ptsg}, PlotRange -> 10,
  Axes -> True]
Out[11]=
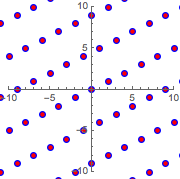
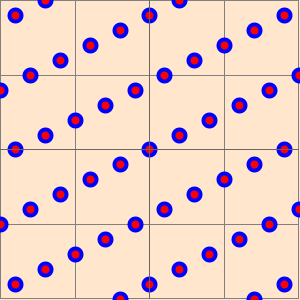
Superimposing the new lattice on the original confirms that they are the same.
In[12]:=
Show[{graphicsb, graphicsg}]Out[12]=