矩阵的谱密度
许多矩阵分布的联合谱密度均有相应的普适极限形式. 对于具有独立项的埃尔米特随机矩阵而言,这是维格纳半圆法.
对于高斯系综,有限矩阵维度的矩阵的缩放谱密度具有解析形式,与量子谐振子的特征函数相关.
使用 MatrixPropertyDistribution 表示高斯酉系综的缩放谱,并提供其联合谱密度的解析表达式.
In[1]:=
scaledSpectrum\[ScriptCapitalD][n_] :=
  MatrixPropertyDistribution[
   Eigenvalues[\[Lambda]]/(2 Sqrt[n]), \[Lambda] \[Distributed]
    GaussianUnitaryMatrixDistribution[n]];
In[2]:=
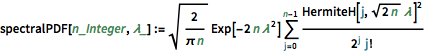
spectralPDF[n_Integer, \[Lambda]_] :=
Sqrt[2/(\[Pi] n)] Exp[-2 n \[Lambda]^2] \!\(
\*UnderoverscriptBox[\(\[Sum]\), \(j = 0\), \(n - 1\)]
\*FractionBox[
SuperscriptBox[\(HermiteH[j,
\*SqrtBox[\(2\ n\)]\ \[Lambda]]\), \(2\)], \(
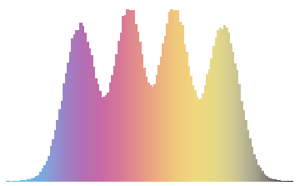
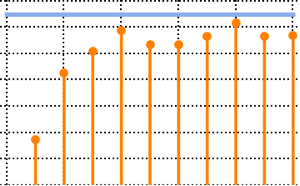
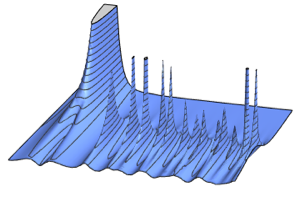
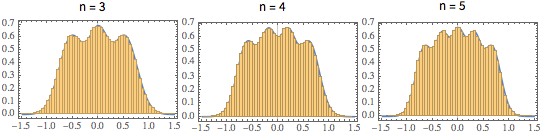
\*SuperscriptBox[\(2\), \(j\)]\ \(j!\)\)]\)对于小的矩阵维度,有一个独特的振荡模式,其密度极大值的个数等于矩阵大小.
In[3]:=
scaledSpectra =
  Flatten[RandomVariate[scaledSpectrum\[ScriptCapitalD][#],
      10^5]] & /@ {3, 4, 5};
显示完整的 Wolfram 语言输入
Out[4]=
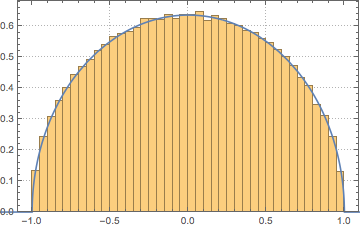
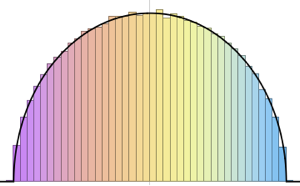
在大维度的极限情况下,密度收敛于 WignerSemicircleDistribution.
In[5]:=
n = 250;
scaledSpectrum =
  Flatten[RandomVariate[scaledSpectrum\[ScriptCapitalD][n], 10^2]];
显示完整的 Wolfram 语言输入
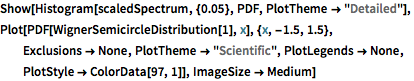
Out[6]=