Wolfram Language

Richer Knowledgebase Access

Analyze, Visualize, and Compare "Superfoods"

Superfoods are foods that are very high in one or more nutrients. This example defines a set of superfoods, then contrasts them with more "typical" foods using food data from the Wolfram Knowledgebase. Finally, it constructs an insignia appropriate for foods worthy of the "super" epithet.

First, define a list of superfoods containing the nutrients for which they are known.

In[1]:=
Click for copyable input
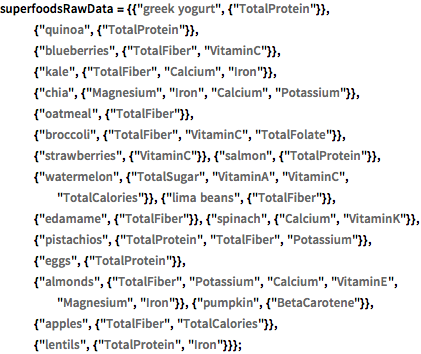
superfoodsRawData = {{"greek yogurt", {"TotalProtein"}}, {"quinoa", \ {"TotalProtein"}}, {"blueberries", {"TotalFiber", "VitaminC"}}, {"kale", {"TotalFiber", "Calcium", "Iron"}}, {"chia", {"Magnesium", "Iron", "Calcium", "Potassium"}}, {"oatmeal", {"TotalFiber"}}, {"broccoli", \ {"TotalFiber", "VitaminC", "TotalFolate"}}, {"strawberries", {"VitaminC"}}, {"salmon", \ {"TotalProtein"}}, {"watermelon", {"TotalSugar", "VitaminA", "VitaminC", "TotalCalories"}}, {"lima beans", {"TotalFiber"}}, {"edamame", {"TotalFiber"}}, {"spinach", {"Calcium", "VitaminK"}}, {"pistachios", {"TotalProtein", "TotalFiber", "Potassium"}}, {"eggs", {"TotalProtein"}}, {"almonds", \ {"TotalFiber", "Potassium", "Calcium", "VitaminE", "Magnesium", "Iron"}}, {"pumpkin", {"BetaCarotene"}}, {"apples", \ {"TotalFiber", "TotalCalories"}}, {"lentils", {"TotalProtein", "Iron"}}};

Convert this to a Dataset for easier computation.

In[2]:=
Click for copyable input
superfoodsDatset = Dataset[<|"Food" -> #1, "Nutrients" -> #2|> & @@@ superfoodsRawData]
Out[2]=

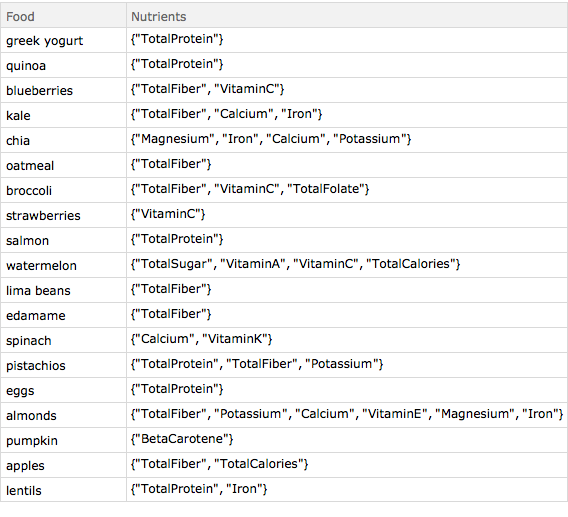
Use Interpreter to get Wolfram Language entities for the superfoods.
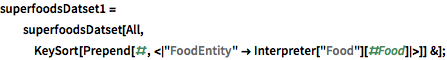
In[3]:=
Click for copyable input
superfoodsDatset1 = superfoodsDatset[All, KeySort[Prepend[#, <| "FoodEntity" -> Interpreter["Food"][#Food]|>]] &];

List the nutrients.

In[4]:=
Click for copyable input
Union @@ Normal[superfoodsDatset1[[All, "Nutrients"]]]
Out[4]=

Create rules to convert the given nutrients to their appropriate properties.
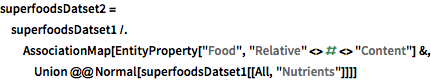
In[5]:=
Click for copyable input
superfoodsDatset2 = superfoodsDatset1 /. AssociationMap[ EntityProperty["Food", "Relative" <> # <> "Content"] &, Union @@ Normal[superfoodsDatset1[[All, "Nutrients"]]]]
Out[5]=

Find the most common nutrients in the Dataset.

In[6]:=
Click for copyable input
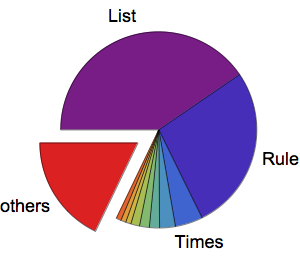
mostCommonProperties = superfoodsDatset2[Counts[Flatten[#]] &, "Nutrients"][TakeLargest[5]]
Out[6]=

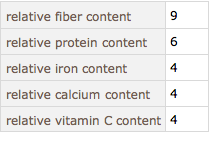
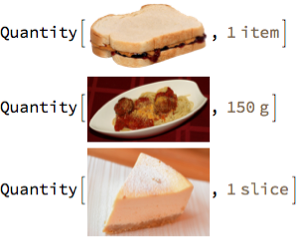
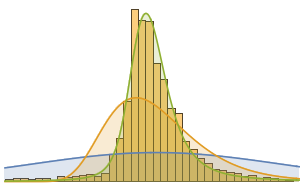
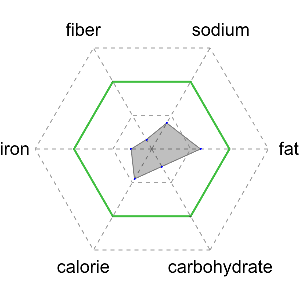
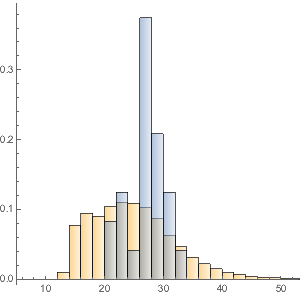
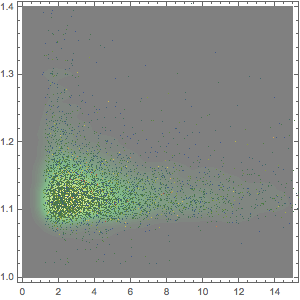
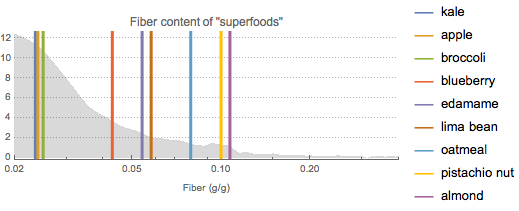
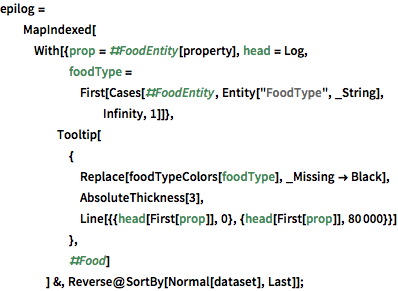
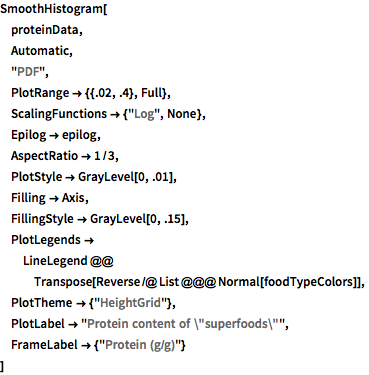
Find superfoods known for being high in fiber and compare them to nearly 9000 other foods. Visualize as a smoothed histogram, where the gray curve shows the probability density function of fiber content for most foods.
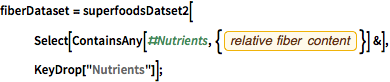
In[7]:=
Click for copyable input
fiberDataset = superfoodsDatset2[ Select[ContainsAny[#Nutrients, {EntityProperty["Food", "RelativeTotalFiberContent"]}] &], KeyDrop["Nutrients"]];
show complete Wolfram Language input
In[8]:=
Click for copyable input
foodTypeColors = <| Entity["FoodType", "Kale"] -> Directive[ColorData[97, 1]], Entity["FoodType", "Apple"] -> Directive[ColorData[97, 2]], Entity["FoodType", "Broccoli"] -> Directive[ColorData[97, 3]], Entity["FoodType", "Blueberry"] -> Directive[ColorData[97, 4]], Entity["FoodType", "Edamame"] -> Directive[ColorData[97, 5]], Entity["FoodType", "LimaBean"] -> Directive[ColorData[97, 6]], Entity["FoodType", "Oatmeal"] -> Directive[ColorData[97, 7]], Entity["FoodType", "PistachioNut"] -> Directive[ColorData[97, 8]], Entity["FoodType", "Almond"] -> Directive[ColorData[97, 9]] |>;
In[9]:=
Click for copyable input
property = EntityProperty["Food", "RelativeTotalFiberContent"];
In[10]:=
Click for copyable input
data = DeleteMissing[ EntityValue[EntityClass["Food", "DataSource" -> "USDA"], property]];
In[11]:=
Click for copyable input
fiberData = Flatten[data] /. {Quantity[a_, ___] :> a};
In[12]:=
Click for copyable input
epilog = MapIndexed[ With[{prop = #FoodEntity[property], head = Log, foodType = First[Cases[#FoodEntity, Entity["FoodType", _String], Infinity, 1]]}, Tooltip[ { foodTypeColors[foodType], AbsoluteThickness[3], Line[{{head[First[prop]], 0}, {head[First[prop]], 80}}] }, #Food] ] &, Reverse@SortBy[Normal[fiberDataset], Last]];
In[13]:=
Click for copyable input
SmoothHistogram[ fiberData, Automatic, "PDF", PlotRange -> {{.02, .4}, Full}, ScalingFunctions -> {"Log", None}, AspectRatio -> 1/3, Epilog -> epilog, PlotStyle -> GrayLevel[0, .01], Filling -> Axis, FillingStyle -> GrayLevel[0, .15], PlotTheme -> {"HeightGrid"}, PlotLegends -> LineLegend @@ Transpose[Reverse /@ List @@@ Normal[foodTypeColors]], PlotLabel -> "Fiber content of \"superfoods\"", FrameLabel -> {"Fiber (g/g)"} ]
Out[13]=

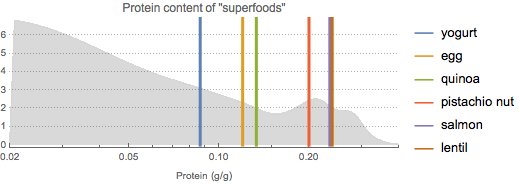
Do the same process for protein-rich superfoods.
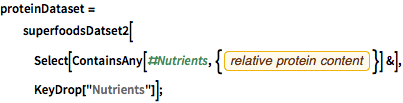
In[14]:=
Click for copyable input
proteinDataset = superfoodsDatset2[ Select[ContainsAny[#Nutrients, {EntityProperty["Food", "RelativeTotalProteinContent"]}] &], KeyDrop["Nutrients"]];
show complete Wolfram Language input
In[15]:=
Click for copyable input
foodTypeColors = <| Entity["FoodType", "Yogurt"] -> Directive[ColorData[97, 1]], Entity["FoodType", "Egg"] -> Directive[ColorData[97, 2]], Entity["FoodType", "Quinoa"] -> Directive[ColorData[97, 3]], Entity["FoodType", "PistachioNut"] -> Directive[ColorData[97, 4]], Entity["FoodType", "Salmon"] -> Directive[ColorData[97, 5]], Entity["FoodType", "Lentil"] -> Directive[ColorData[97, 6]] |>;
In[16]:=
Click for copyable input
property = EntityProperty["Food", "RelativeTotalProteinContent"];
In[17]:=
Click for copyable input
dataset = proteinDataset;
In[18]:=
Click for copyable input
data = DeleteMissing[ EntityValue[EntityClass["Food", "DataSource" -> "USDA"], property]];
In[19]:=
Click for copyable input
proteinData = Flatten[data] /. {Quantity[a_, ___] :> a};
In[20]:=
Click for copyable input
epilog = MapIndexed[ With[{prop = #FoodEntity[property], head = Log, foodType = First[Cases[#FoodEntity, Entity["FoodType", _String], Infinity, 1]]}, Tooltip[ { Replace[foodTypeColors[foodType], _Missing -> Black], AbsoluteThickness[3], Line[{{head[First[prop]], 0}, {head[First[prop]], 80000}}] }, #Food] ] &, Reverse@SortBy[Normal[dataset], Last]];
In[21]:=
Click for copyable input
SmoothHistogram[ proteinData, Automatic, "PDF", PlotRange -> {{.02, .4}, Full}, ScalingFunctions -> {"Log", None}, Epilog -> epilog, AspectRatio -> 1/3, PlotStyle -> GrayLevel[0, .01], Filling -> Axis, FillingStyle -> GrayLevel[0, .15], PlotLegends -> LineLegend @@ Transpose[Reverse /@ List @@@ Normal[foodTypeColors]], PlotTheme -> {"HeightGrid"}, PlotLabel -> "Protein content of \"superfoods\"", FrameLabel -> {"Protein (g/g)"} ]
Out[21]=

Create a superfoods insignia, beginning with a set of superfood images.
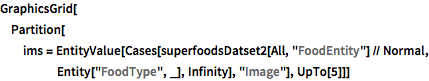
In[22]:=
Click for copyable input
GraphicsGrid[ Partition[ ims = EntityValue[ Cases[superfoodsDatset2[All, "FoodEntity"] // Normal, Entity["FoodType", _], Infinity], "Image"], UpTo[5]]]
Out[22]=

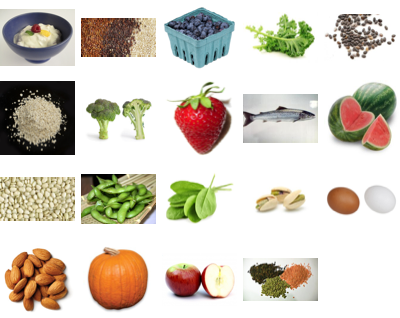
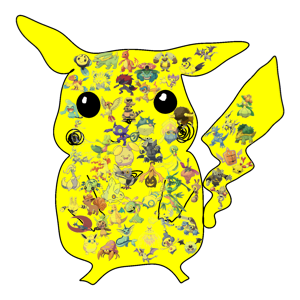
As the background, use a shape resembling that of a well-known super.

In[23]:=
Click for copyable input
Entity["Lamina", "SupermanInsigniaLamina"]["Image"] // ImageCrop
Out[23]=

Use some simple image processing to convert it to a background.
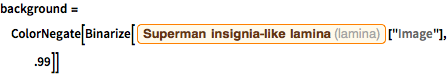
In[24]:=
Click for copyable input
background = ColorNegate[ Binarize[Entity["Lamina", "SupermanInsigniaLamina"]["Image"], .99]]
Out[24]=

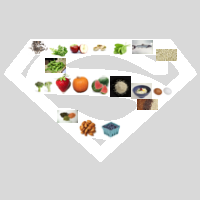
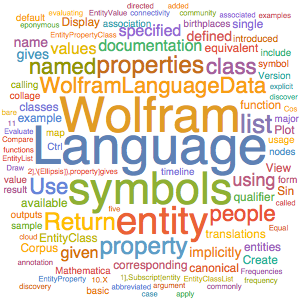
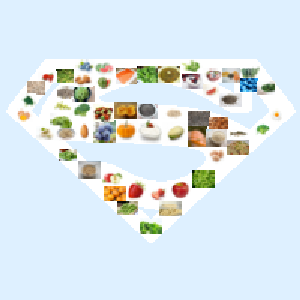
Create a "word cloud" consisting of superfoods.

In[25]:=
Click for copyable input
wc = WordCloud[(RandomReal[{0.6, 1.2}] -> #) & /@ ims, background]
Out[25]=

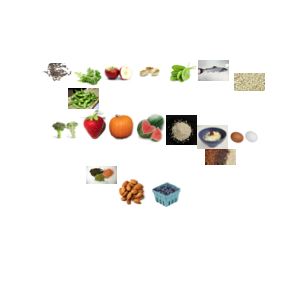
Combine the word cloud and background.

In[26]:=
Click for copyable input
ImageMultiply[{ColorReplace[background, Black -> LightGray], wc}]
Out[26]=

Related Examples

de es fr ja ko pt-br ru zh