National Science Foundation Grants
The US National Science Foundation (NSF) awarded nearly 12,000 grants in 2015. Here, awards, investigators, and their affiliated institutions are analyzed using data available from www.nsf.gov/awardsearch/download.jsp. In particular, you can load an entity store containing this data as a ResourceObject, then explore the distribution of grant sizes, quantitative and qualitative properties of the proposals and grants, and geographic dispersal of associated institutions.
To begin, load an entity store containing the NSF data from a ResourceObject.
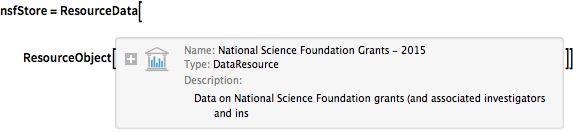
nsfStore = ResourceData[

ResourceObject[
Association[
   "Name" -> "National Science Foundation Grants - 2015",
    "UUID" -> "0e9655df-86b6-4e20-bcc9-87365562357b",
    "ResourceType" -> "DataResource", "Version" -> "1.0.0",
    "Description" -> "Data on National Science Foundation grants (and \
associated investigators and institutions) awarded in the the year \
2015.", "ContentSize" -> Quantity[0, "Bytes"],
    "ContentElements" -> {"EntityStore"}]]]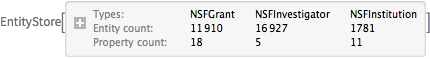
Register the store for this session.
PrependTo[$EntityStores, nsfStore];View available grant properties using the "NSFGrant" entity type from the store.
EntityValue["NSFGrant", "Properties"]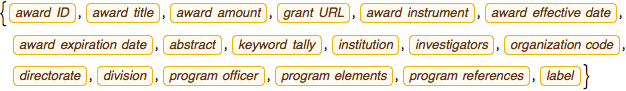
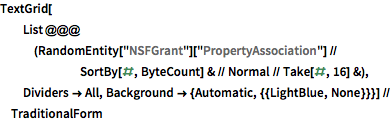
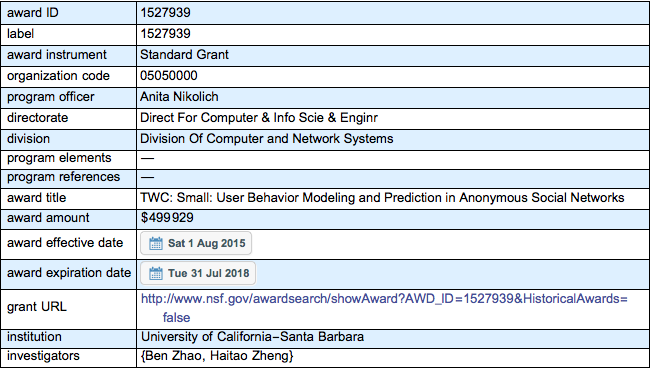
Return data on a randomly selected grant.
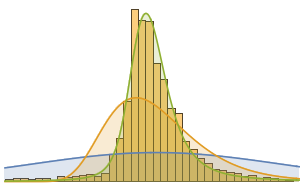
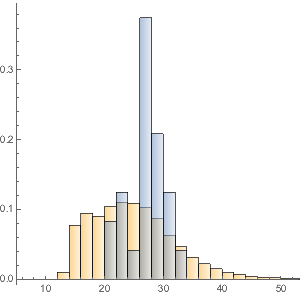
Plot the distribution of grant sizes.
awardAmounts = EntityValue["NSFGrant", "AwardAmount"];Histogram[awardAmounts, ScalingFunctions -> {Identity, "Log"},
PlotRange -> All, AxesLabel -> Automatic]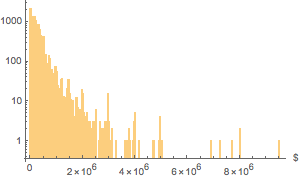
Show details for the three largest grants.
EntityValue[
 EntityClass["NSFGrant", "AwardAmount" -> TakeLargest[3]], "Dataset"]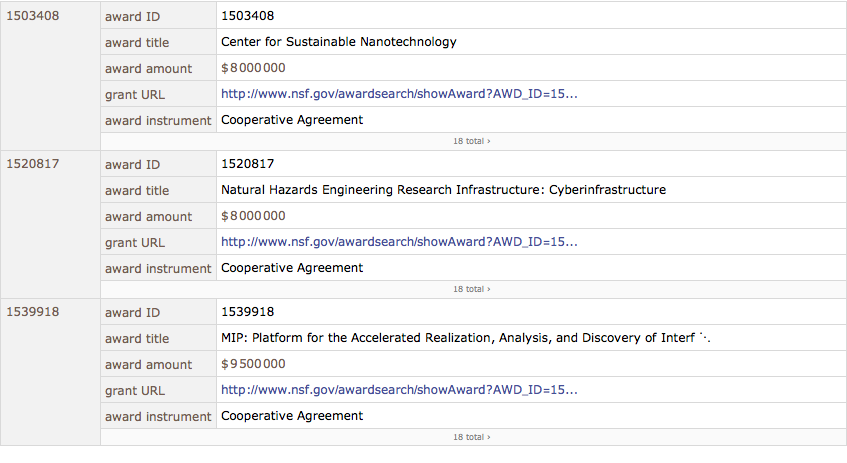
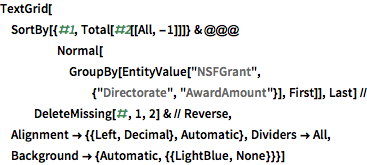
Examine total grant awards for each NSF directorate.
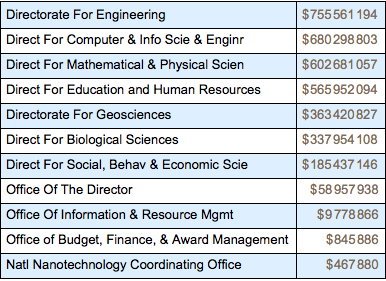
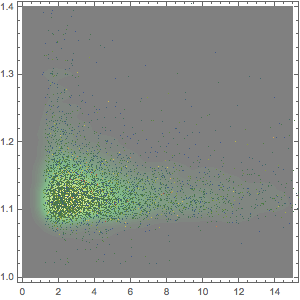
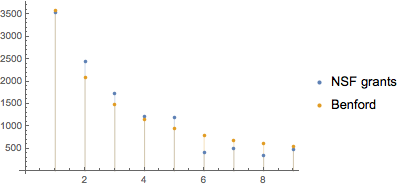
Compare the distribution of the first digits of the award dollar amounts with Benford's law.
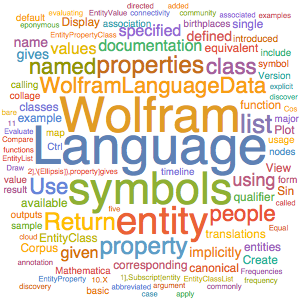
Make a word cloud of the most-used words in mathematics, physics, and chemistry grants.
keywords =
  EntityValue[EntityClass["NSFGrant", "Division" -> #],
     "KeywordTally"] & /@ {"Division Of Mathematical Sciences",
    "Division Of Physics", "Division Of Chemistry"};
Row[WordCloud[
    Merge[Association @@ (Rule @@@ #) & /@ DeleteMissing[#],
     Total]] & /@ keywords]
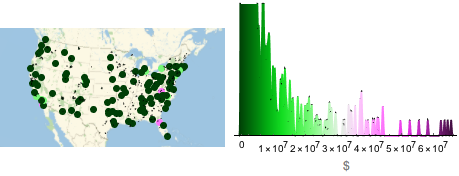
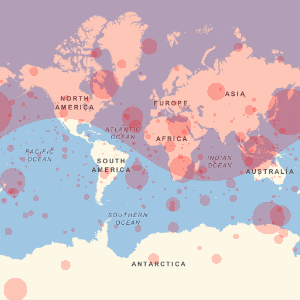
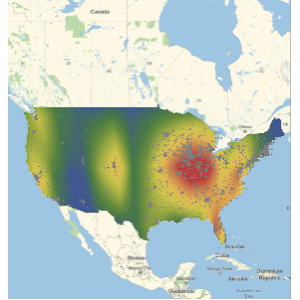
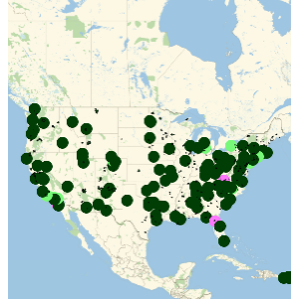
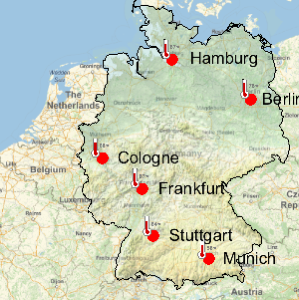
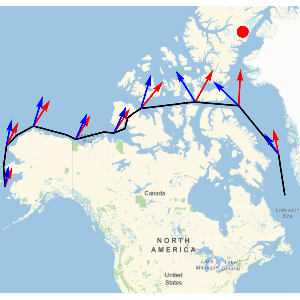
Visualize NSF grants by amount and ZIP code.