Arrays of Quantities
QuantityArray allows efficient storage and manipulation of arrays of Quantity objects, and it is hence ideal for the analysis of data having physical units. Continuing with the integration of quantities throughout the system, several functions now understand or return QuantityArray objects.
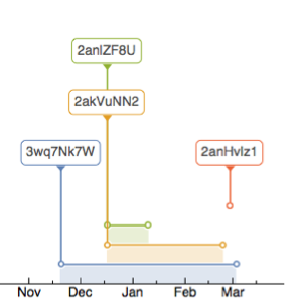
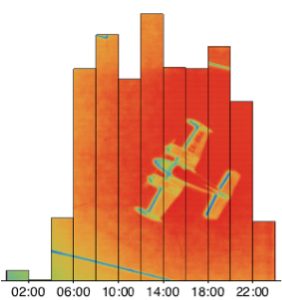
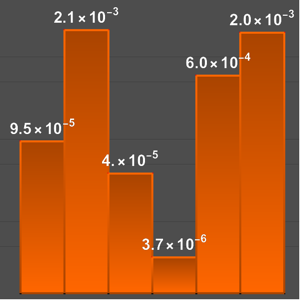
Sample QuantityDistribution objects.
RandomVariate[ParetoDistribution[Quantity[500., "USDollars"], 4], 300]A QuantityArray object is equivalent to a normal array of Quantity elements.
RandomVariate[ParetoDistribution[Quantity[500., "USDollars"], 4], 300];
Normal[Take[%, 10]]Compute or download arrays of geo data, like elevation or magnetic field data.
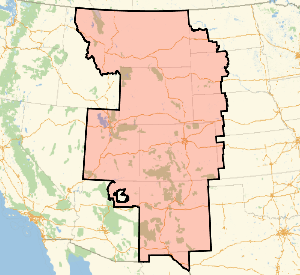
GeoElevationData[Entity["Country", "UnitedStates"]]GeomagneticModelData[
Entity["GeographicRegion", "Antarctica"], "Magnitude"]Manipulate arrays of latitude and longitude angles.
GeoElevationData[
 Entity["Country", "UnitedStates"], "Undulation", GeoPosition]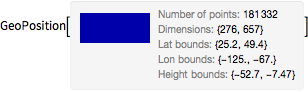
GeoElevationData[
 Entity["Country", "UnitedStates"], "Undulation", GeoPosition];
LatitudeLongitude[%]Get an array of data for the vertical component of the gravitational field over China.
data = GeogravityModelData[Entity["Country", "China"],
  "DownComponent"]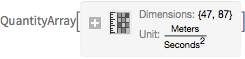
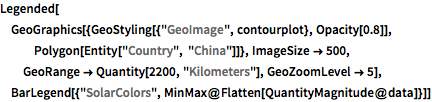
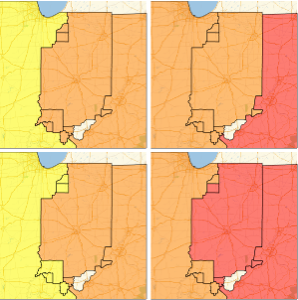
Examine how the gravitational field differs from the standard value of 9.81  over that region.
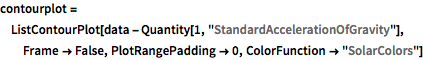
contourplot =
 ListContourPlot[data - Quantity[1, "StandardAccelerationOfGravity"],
  Frame -> False, PlotRangePadding -> 0,
  ColorFunction -> "SolarColors"]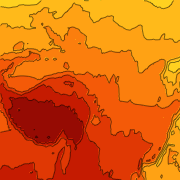
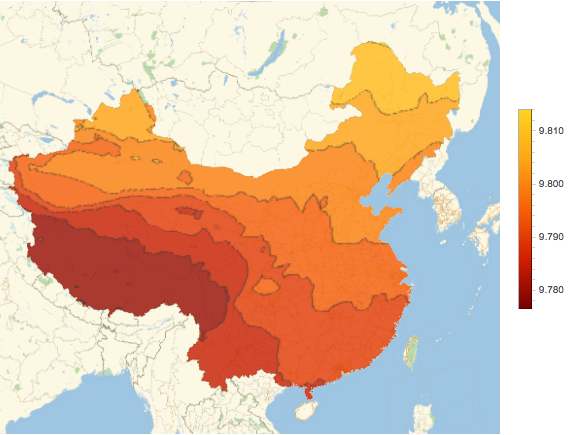
Overlay the contour plot over a map of China.