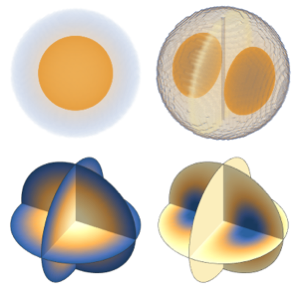
メガ密度プロット
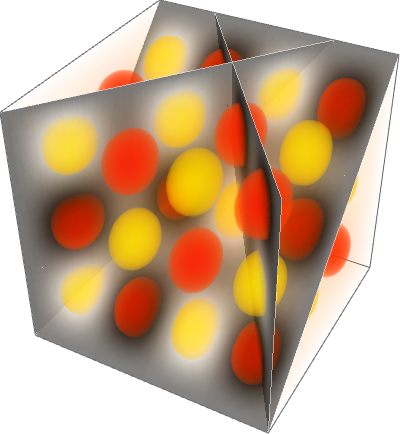
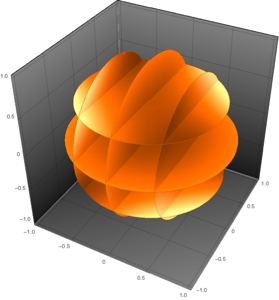
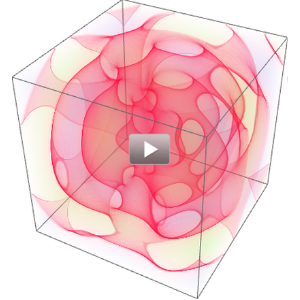
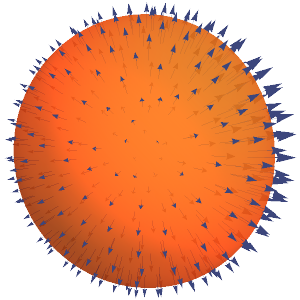
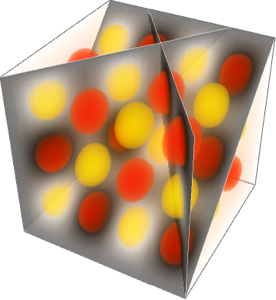
極値の部分が最も不透明にして,関数の3D密度プロットを作る.
In[1]:=
density =
 DensityPlot3D[
  Sin[\[Pi] x] Sin[\[Pi] y] Sin[\[Pi] z], {x, -2, 2}, {y, -2,
   1}, {z, -2, 1},
  ColorFunction -> (Blend[{RGBColor[1, 0, 0], RGBColor[
       1, 1, 0]}, #] &),
  OpacityFunction -> Function[f, If[Abs[f] > .5, .22, .01]],
  OpacityFunctionScaling -> False, PlotTheme -> "Minimal"]
Out[1]=
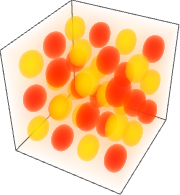
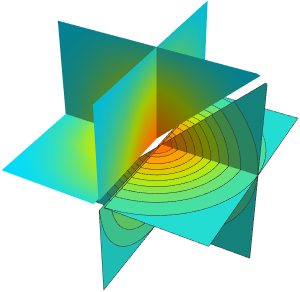
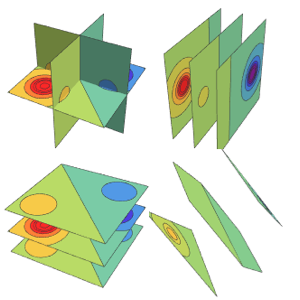
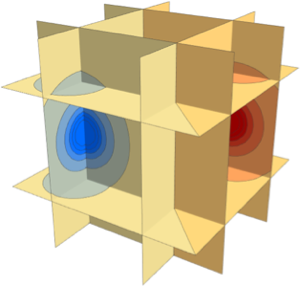
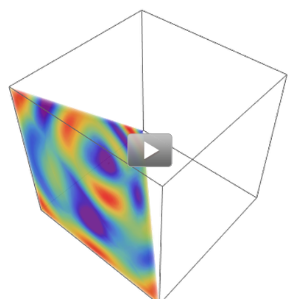
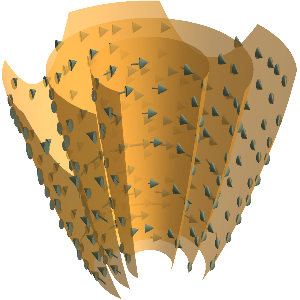
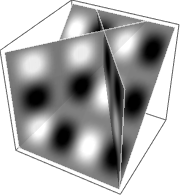
領域をスライスする面上で同じ関数をプロットする.
In[2]:=
slices = SliceDensityPlot3D[
  Sin[\[Pi] x] Sin[\[Pi] y] Sin[\[Pi] z], {z == y, x == y,
   x == -y}, {x, -2, 2}, {y, -2, 1}, {z, -2, 1},
  BoundaryStyle -> Directive[GrayLevel[1, .5], AbsoluteThickness[1]],
  ColorFunction -> (Abs[#] &), PlotPoints -> 60,
  PlotTheme -> "Minimal"]
Out[2]=
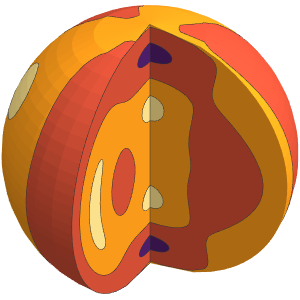
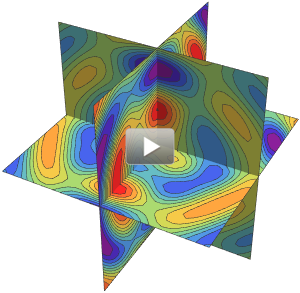
2つのプロットを組み合せてメガ密度プロットを作る.
In[3]:=
Rasterize[Show[density, slices, ImageSize -> 400]]Out[3]=