Segmentation & Fluorescent Uptake of Cells
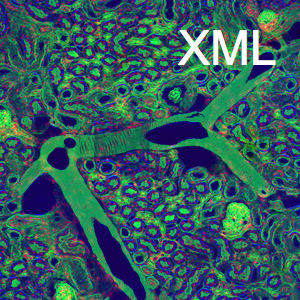
This example demonstrates how to segment an image of stained rat brain cells and identify and count cells with fluorescent marker uptake.
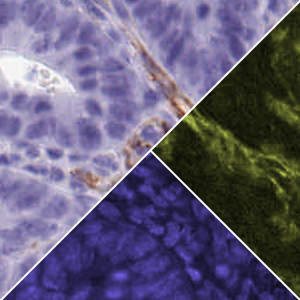
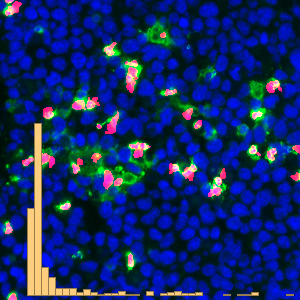
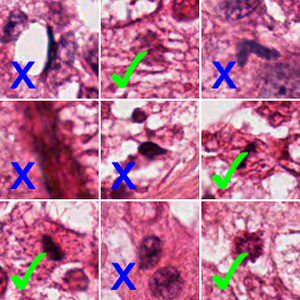
Stained rat brain cells are visible in the blue image channel.
The fluorescent marker is exhibited in the green channel.
Regularize the cell image with a bilateral filter.
Extract a background mask with hysteresis thresholding.
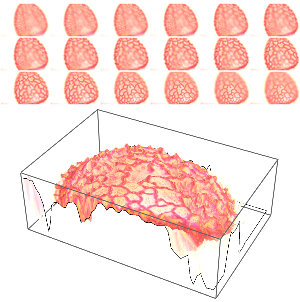
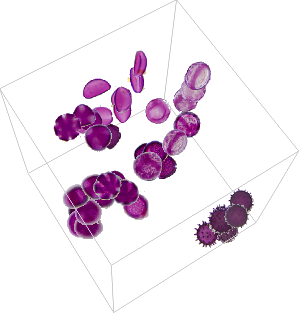
Seek a seed point for every cell by looking for maxima at a given scale  .
.
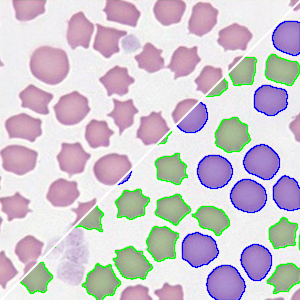
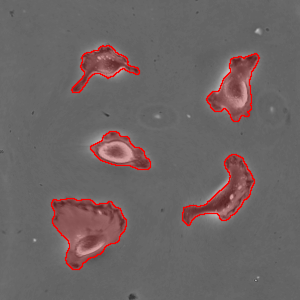
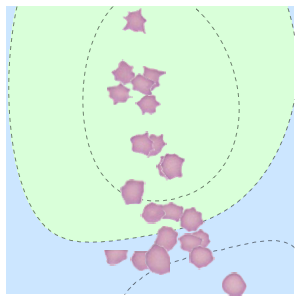
Obtain a cell segmentation via the watershed algorithm.
Measure the amount of fluorescence in each cell segment.
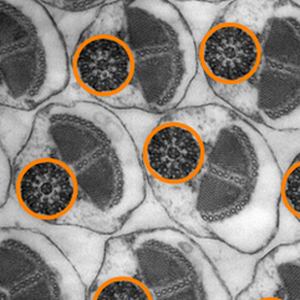
Visualize all the cells with more than a certain fluorescent uptake.