Create Custom Visualizations
Simulation results from a modeled system can often be hard to grasp and understand without further processing and reasoning. Visualization can be used to present the data in an understandable form.
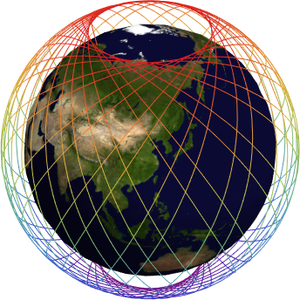
In the following example, a custom visualization is created to show the path of a geocentric, inclined circular Low Earth Orbit (LEO) satellite.
Simulate and obtain the position and velocity data of the satellite.
Create a 3D plot of the Earth. An example of how to create such a plot can be found on the Texture reference page.
Define functions for a 3D plot of the satellite's path.
Define functions for a 2D plot of the satellite's path.
Create a report using the custom visualization functions.
Obtain the report for a time instant.
You can also visualize the simulation results and the satellite trajectory by making an animation over time. An interesting thing to add would be the cities closest to the satellite.