| 4 | Displaying Lists |
ListPlot is one way to display, or visualize, a list of numbers. There are lots of others. Different ones tend to emphasize different features of a list.
ListLinePlot plots a list, joining up values:
| In[1]:= |
| Out[1]= | 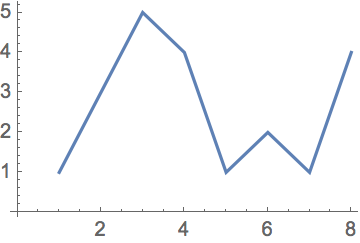
|
When values jump around, it’s usually harder to understand if you don’t join them up:
| In[2]:= |
| Out[2]= | 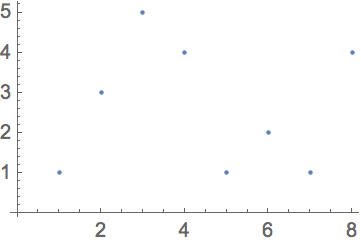
|
| In[3]:= |
| Out[3]= | 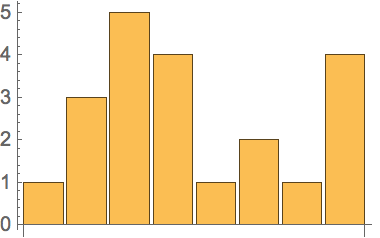
|
| In[4]:= |
| Out[4]= | 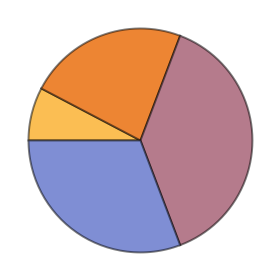
|
| In[5]:= |
| Out[5]= |
| In[6]:= |
| Out[6]= |
Lists can contain anything, including graphics. So you can combine plots by putting them in lists.
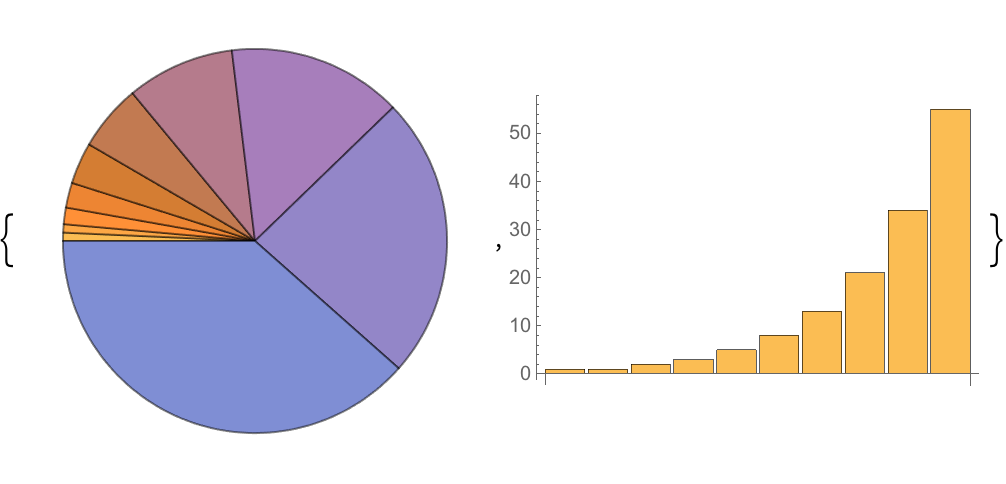
Make a list of two pie charts:
| In[7]:= |
| Out[7]= | 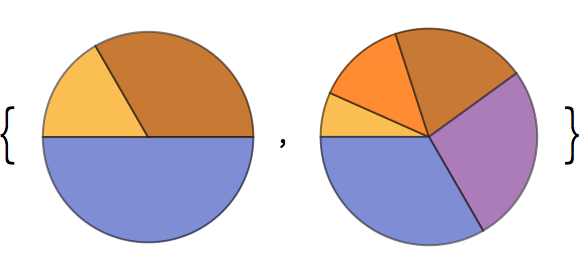
|
Show three bar charts together:
| In[8]:= |
| Out[8]= | 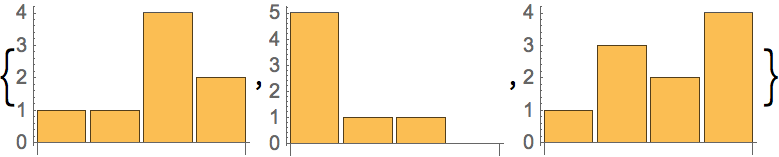
|
| ListLinePlot[{1,2,5}] | values joined by a line | |
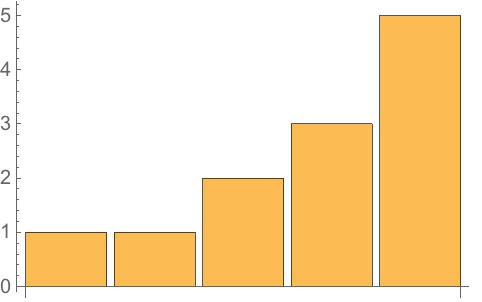
| BarChart[{1,2,5}] | bar chart (values give bar heights) | |
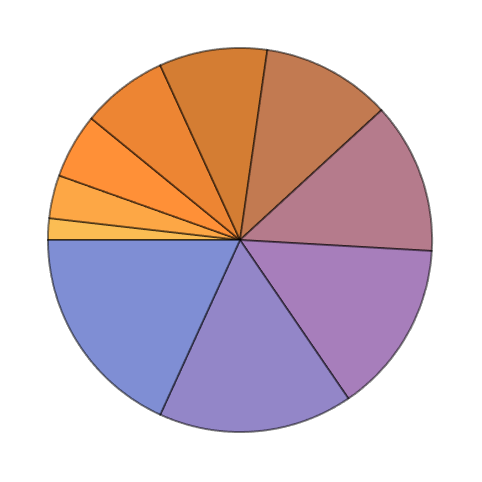
| PieChart[{1,2,5}] | pie chart (values give wedge sizes) | |
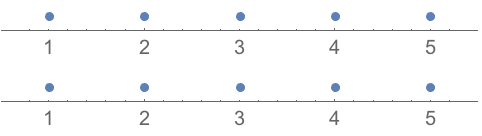
| NumberLinePlot[{1,2,5}] | numbers arranged on a line | |
| Column[{1,2,5}] | elements displayed in a column |

4.2Make a pie chart of numbers from 1 to 10. »
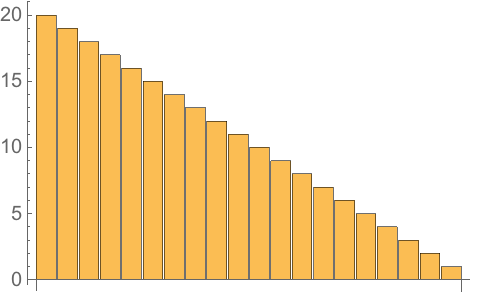
4.3Make a bar chart of numbers counting down from 20 to 1. »
4.4Display numbers from 1 to 5 in a column. »

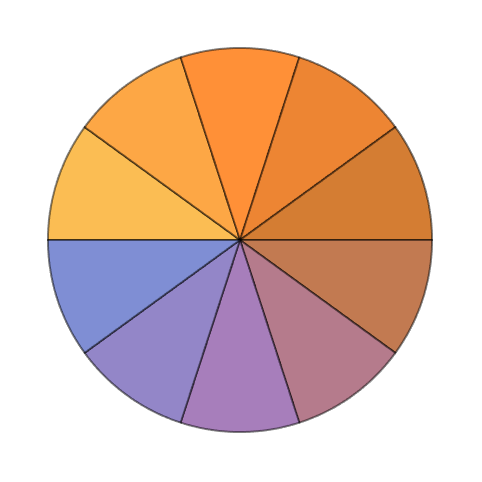
4.6Make a pie chart with 10 identical segments, each of size 1. »
4.7Make a column of pie charts with 1, 2 and 3 identical segments. »
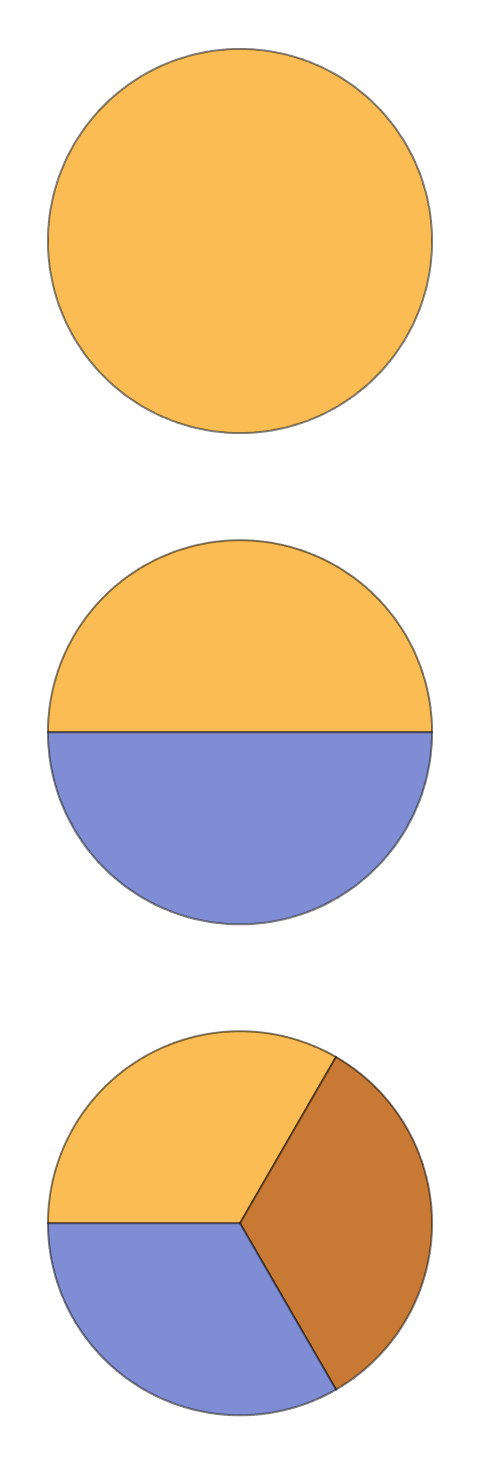
+4.1Make a list of pie charts with 1, 2 and 3 identical segments. »

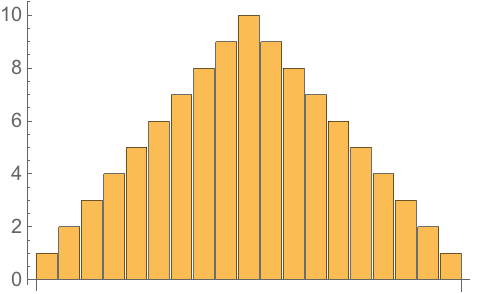
+4.2Make a bar chart of the sequence 1, 2, 3, ..., 9, 10, 9, 8, 7, ..., 1. »
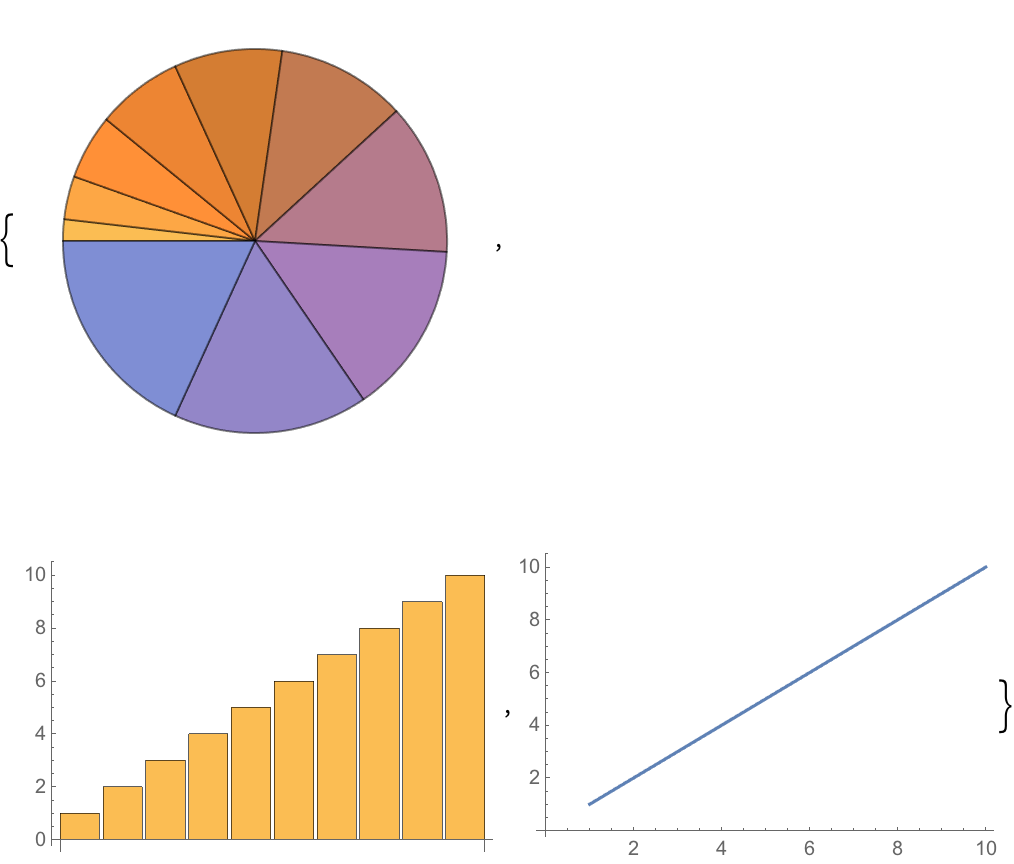
+4.3Make a list of a pie chart, bar chart and line plot of the numbers from 1 to 10. »
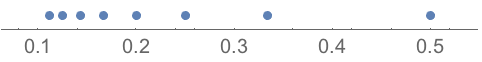
+4.6Make a number line of fractions 1/2, 1/3, ... through 1/9. »
How do pie charts work in the Wolfram Language?
As in any pie chart, the wedges have relative sizes determined by the relative sizes of numbers in the list. In the Wolfram Language, the wedge for the first number starts at the 9 o’clock position, and then subsequent wedges read clockwise. The colors of the wedges are chosen in a definite sequence.
How is the vertical scale determined on plots?
It’s set up to automatically include all points except distant outliers. Later on (Section 20), we’ll talk about the PlotRange option, which lets you specify the exact range of the plot.