Earlier we saw how to use
Framed to add a frame when one displays something.
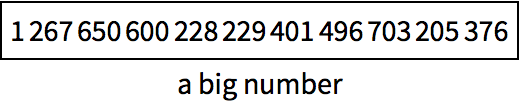
Generate a number and put a frame around it:
You can give options to
Framed.
Specify a background color and a frame style:
Labeled lets you make things be labeled.
Add a label to the framed number:
This adds a label to a number styled with a yellow background:
This adds styling to the label:
You can use
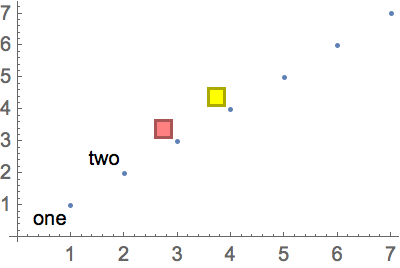
Labeled in graphics as well.
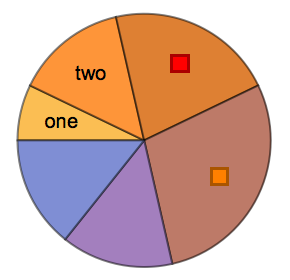
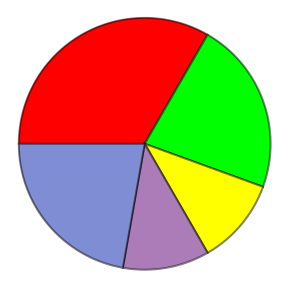
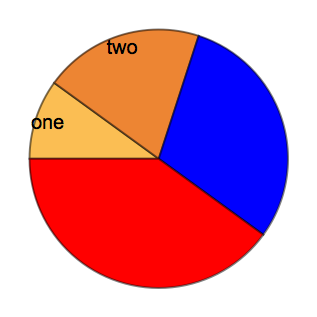
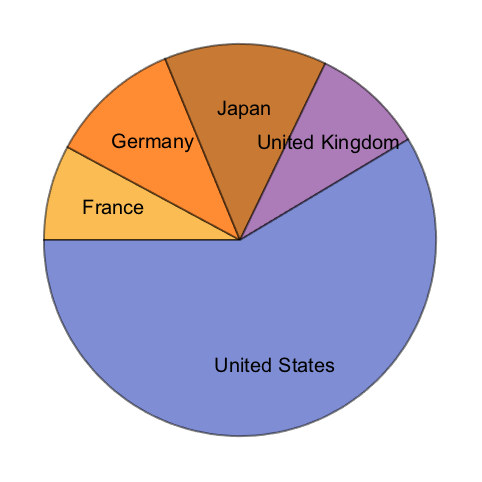
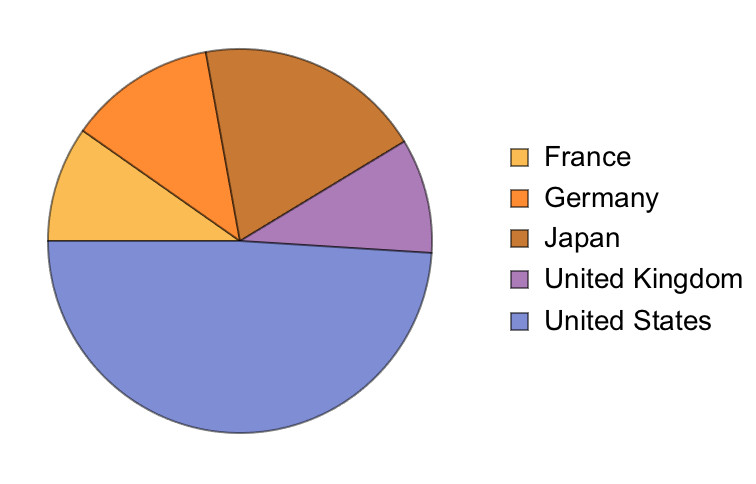
Make a pie chart in which some wedges are labeled:
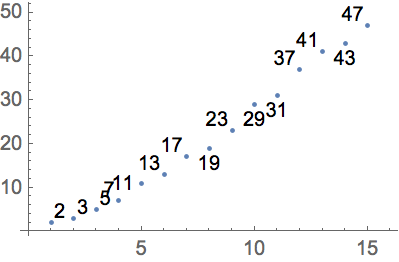
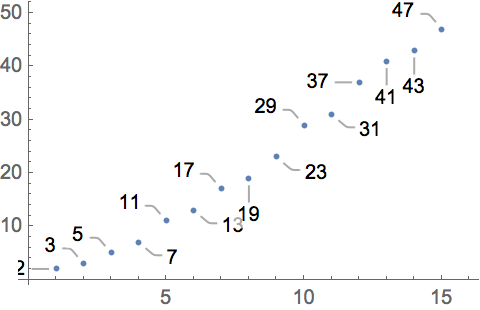
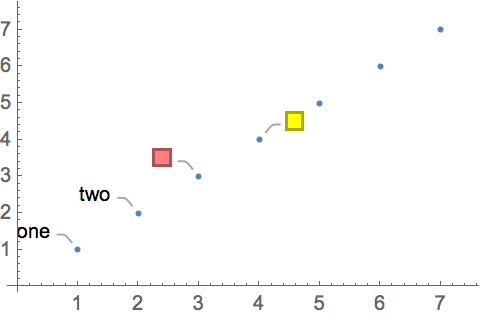
Plot the first few primes labeled with their values:
Labeled indicates something by putting a label right next to it. It
’s often nice instead to use
“callouts
”, that have little lines pointing to whatever they
’re referring to. You can do this by using
Callout rather than
Labeled.
Callout creates
“callouts
” with little lines:
There are all sorts of ways to annotate graphics.
Style directly inserts styling.
Tooltip generates interactive tooltips that show themselves when the mouse hovers over them.
Legended puts labels into a legend on the side.
Specify styles for the first three pie wedges:
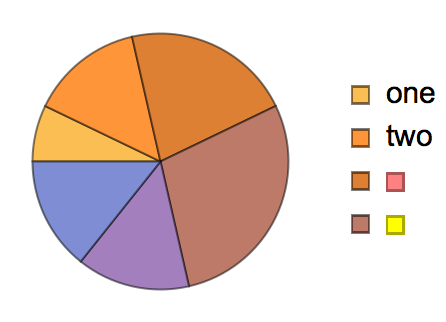
Set up words and colors as legends for pie wedges:
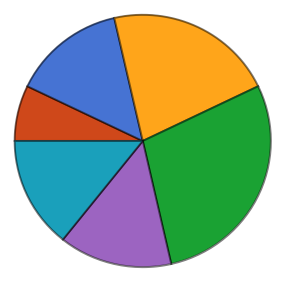
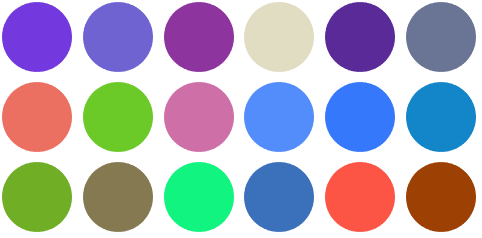
The default plot theme for the web is more brightly colored:
If you want the Wolfram Language to just automatically pick how to annotate things, then simply give the annotations with rules (
).
In
ListPlot, annotations specified by rules are implemented with callouts:
In
PieChart, strings are assumed to be labels, and colors to be styles:
It
’s common to want to combine different objects for presentation.
Row,
Column and
Grid are convenient ways to do this.
Display a list of objects in a row:
Display objects in a column:
Use
GraphicsRow,
GraphicsColumn and
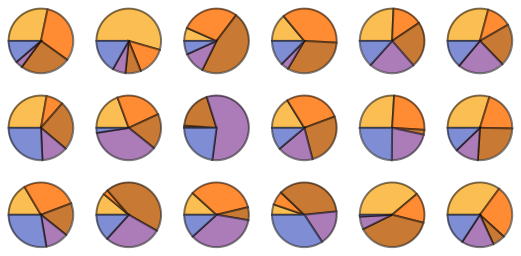
GraphicsGrid to arrange objects to fit in a certain overall size.
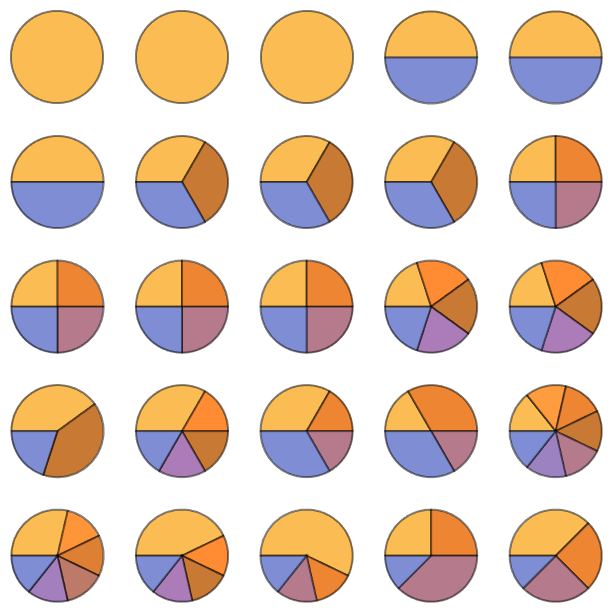
Generate an array of random pie charts, sized to fit:
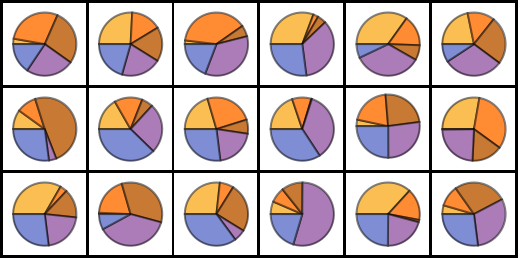
Do it with a frame around everything:
| Framed[expr] | | add a frame |
| Labeled[expr,lab] | | add a label |
| Callout[expr,lab] | | add a callout |
| Tooltip[expr,lab] | | add an interactive tooltip |
| Legended[expr,lab] | | add a legend |
| Row[{expr1,expr2, ...}] | | arrange in a row |
| Column[{expr1,expr2, ...}] | | arrange in a column |
| GraphicsRow[{expr1,expr2, ...}] | | arrange in a resizable row |
| GraphicsColumn[{expr1,expr2, ...}] | | arrange in a resizable column |
| GraphicsGrid[array] | | arrange in a resizable grid |
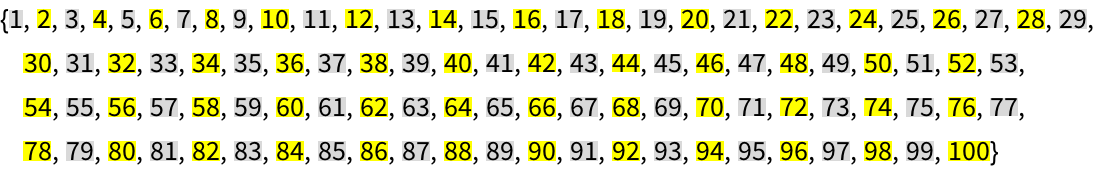
37.1Make a list of numbers up to 100, with even numbers on yellow and odd numbers on light gray.
»
37.2Make a list of numbers up to 100, with primes framed.
»
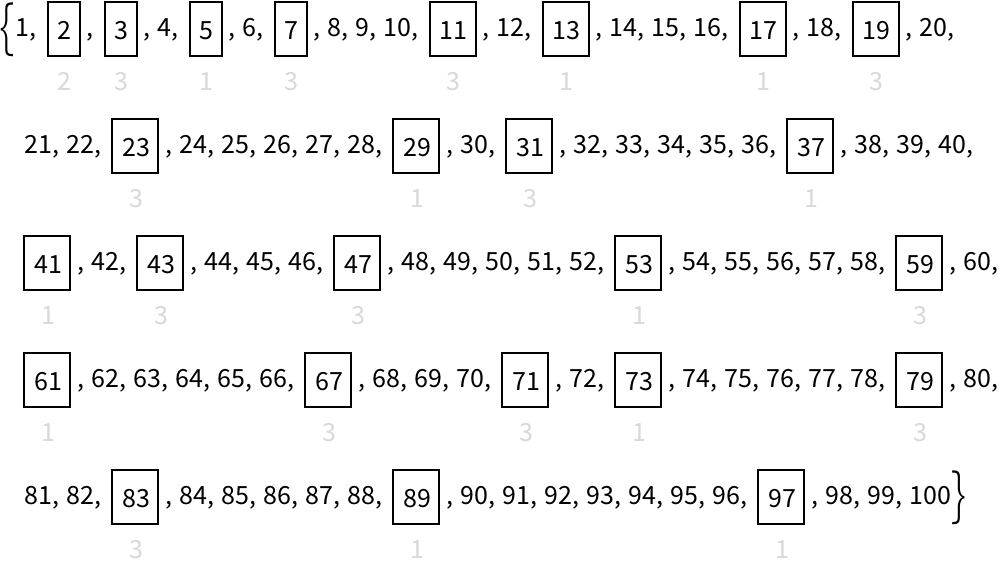
37.3Make a list of numbers up to 100, with primes framed and labeled in light gray with their values modulo 4.
»
37.5Make a pie chart of the GDPs of the countries in the G5, labeling each wedge.
»
37.6Make a pie chart of the populations of the countries in the G5, giving a legend for each wedge.
»
37.7Make a 5
×5
GraphicsGrid of pie charts that give the relative frequencies of digits in
2^n with
n starting at 1.
»
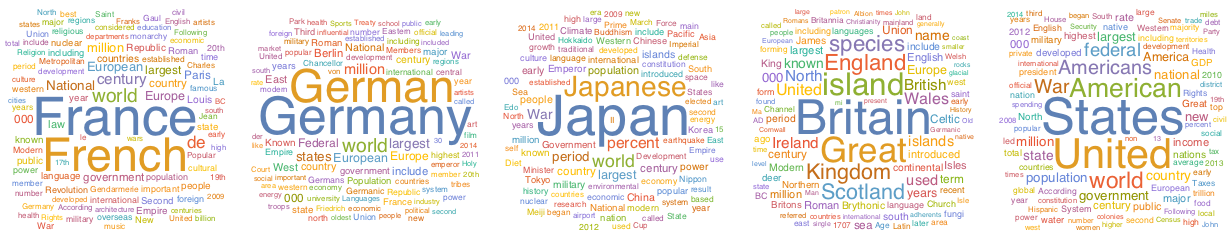
37.8Make a graphics row of word clouds for Wikipedia articles on the G5 countries.
»
Can I get rounded corners with
Framed?
What kinds of things can be in a label?
Anything you want. A label can be text or a graphic or, for that matter, a whole notebook.
Can I use
Labeled to put labels in places other than at the bottom?
How do I determine where a legend goes?
Can visualization be animated or dynamic?
- The Wolfram Language tries to place labels where they won’t interfere with the data that’s being plotted.
- You can resize any graphic using Show[graphic, ImageSizewidth] or Show[graphic, ImageSize{width, height}]. ImageSizeTiny, etc. also work.
- PlotTheme"BlackBackground" may be useful for people with low vision. PlotTheme"Monochrome" avoids using color.
- ListPlot, PieChart, etc. automatically work with associations (...), taking keys to be coordinates when appropriate, but otherwise treating them as annotations.
- There are lots of different kinds of legends: LineLegend, BarLegend, etc.