| 45 | Datasets |
Especially in larger organizations, computing often centers around dealing with large amounts of structured data. The Wolfram Language has a very powerful way to deal with structured data, using what it calls datasets.
A simple example of a dataset is formed from an association of associations.
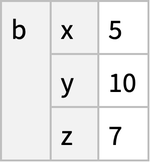
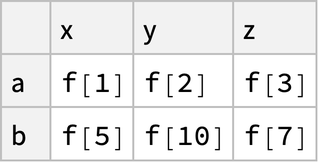
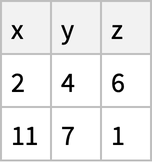
Create a simple dataset that can be viewed as having 2 rows and 3 columns:
In[1]:=
Out[1]=
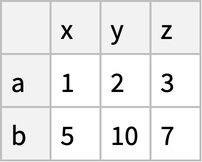
The Wolfram Language displays most datasets in tabular form. You can extract parts from datasets just like you would from associations.
Get the element from “row b” and “column z”:
In[2]:=
Out[2]=
You can first extract the whole “b row”, then get the “z” element of the result:
In[3]:=
Out[3]=
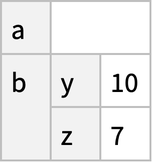
You can also just get the whole “b row” of the dataset. The result is a new dataset, which for ease of reading happens to be displayed in this case as a column.
Generate a new dataset from the “b row” of the original dataset:
In[4]:=
Out[4]=
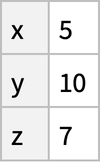
Here is the dataset that corresponds to the “z column” for all “rows”.
Generate a dataset consisting of the “z column” for all rows:
In[5]:=
Out[5]=
Extracting parts of datasets is just the beginning. Anywhere you can ask for a part you can also give a function that will be applied to all parts at that level.
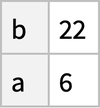
Get totals for each row by applying Total to all columns for all the rows:
In[6]:=
Out[6]=
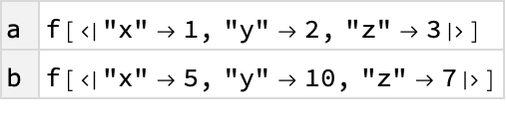
If we use f instead of Total, we can see what’s going on: the function is being applied to each of the “row” associations.
Apply the function f to each row:
In[7]:=
Out[7]=
Apply a function that adds the x and z elements of each association:
In[8]:=
Out[8]=
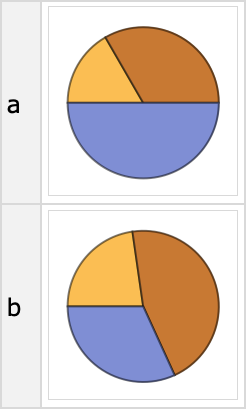
You can use any function; here’s PieChart:
In[9]:=
Out[9]=
You can give a function to apply to all rows too.
This extracts the value of each “z column”, then applies f to the association of results:
In[10]:=
Out[10]=
Apply f to the totals of all columns:
In[11]:=
Out[11]=
In[12]:=
Out[12]=
You can always “chain” queries, for example first finding the totals for all rows, then picking out the result for the “b row”.
Find totals for all rows, then pick out the total for the “b row”:
In[13]:=
Out[13]=
It’s equivalent to this:
In[14]:=
Out[14]=
Particularly when one’s dealing with large datasets, it’s common to want to select parts based on a criterion. The operator form of Select provides a very convenient way to do this.
Select numbers greater than 5 from a list:
In[15]:=
Out[15]=
Another way to get the same answer, using the operator form of Select:
In[16]:=
Out[16]=
The operator form of Select is a function which can be applied to actually perform the Select operation.
Make a dataset by selecting only rows whose “z column” is greater than 5:
In[17]:=
Out[17]=
For each row, select columns whose values are greater than 5, leaving a ragged structure:
In[18]:=
Out[18]=
Normal turns the dataset into an ordinary association of associations:
In[19]:=
Out[19]=
Many Wolfram Language functions have operator forms.
Sort according to the values of a function applied to each element:
In[20]:=
Out[20]=
SortBy has an operator form:
In[21]:=
Out[21]=
Sort rows according to the value of the difference of the x and y columns:
In[22]:=
Out[22]=
Sort the rows, and find the total of all columns:
In[23]:=
Out[23]=
Sometimes you want to apply a function to each element in the dataset.
Apply f to each element in the dataset:
In[24]:=
Out[24]=
Sort the rows before totaling the squares of their elements:
In[25]:=
Out[25]=
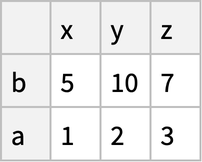
Datasets can contain arbitrary mixtures of lists and associations. Here’s a dataset that can be thought of as a list of records with named fields.
A dataset formed from a list of associations:
In[26]:=
Out[26]=
It’s OK for entries to be missing:
In[27]:=
Out[27]=
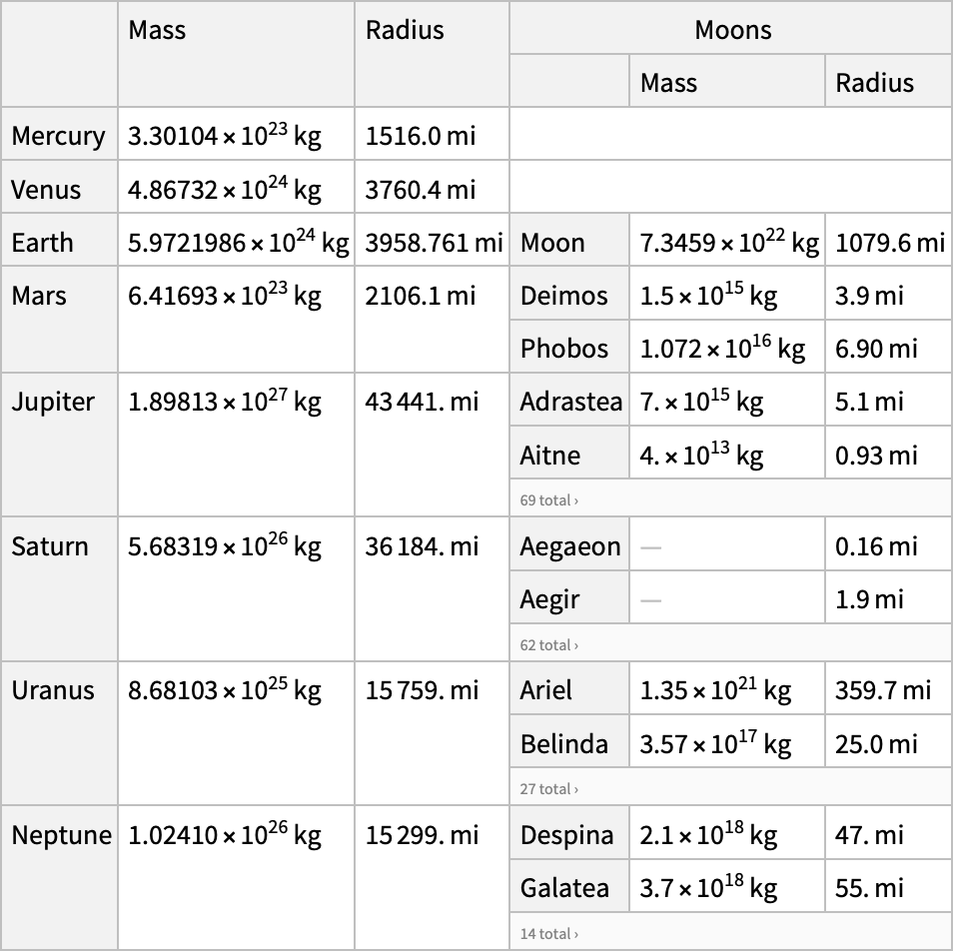
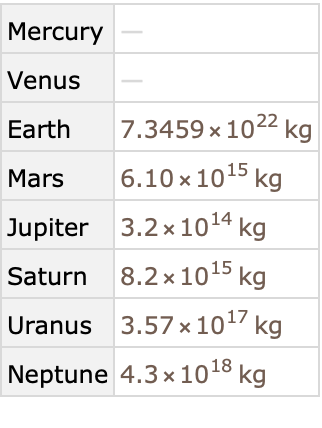
Now that we’ve seen some simple examples, it’s time to look at something slightly more realistic. Let’s import a dataset giving properties of planets and moons. The dataset has a hierarchical structure, with each planet having a mass and radius of its own, and then also having a collection of moons, each of which have their own properties. This general structure is extremely common in practice (think students and grades, customers and orders, etc.).
Get a hierarchical dataset of planets and moons from the cloud:
In[28]:=
Out[28]=
In[29]:=
Out[29]=
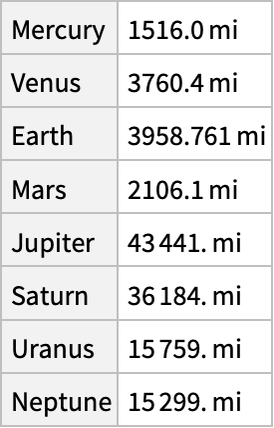
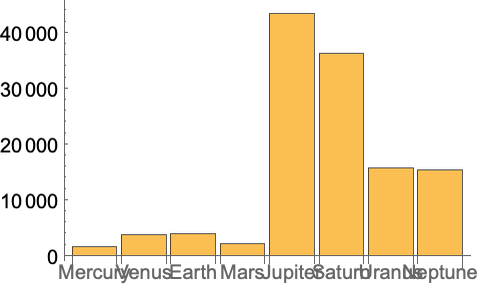
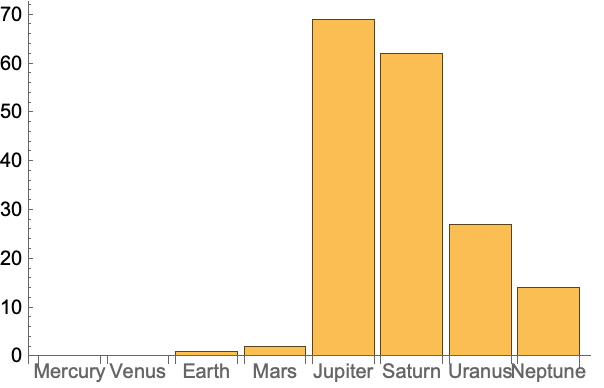
Make a bar chart of planet radii:
In[30]:=
Out[30]=
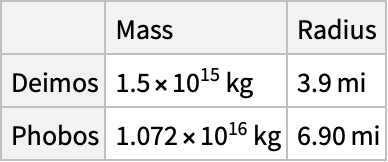
If we ask about the moons of Mars, we get a dataset, which we can then query further.
Get a dataset about the moons of Mars:
In[31]:=
Out[31]=
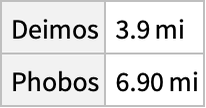
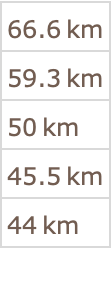
“Drill down” to make a table of radii of all the moons of Mars:
In[32]:=
Out[32]=
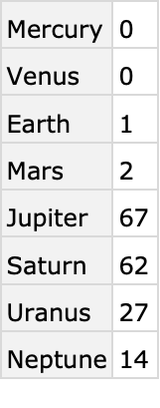
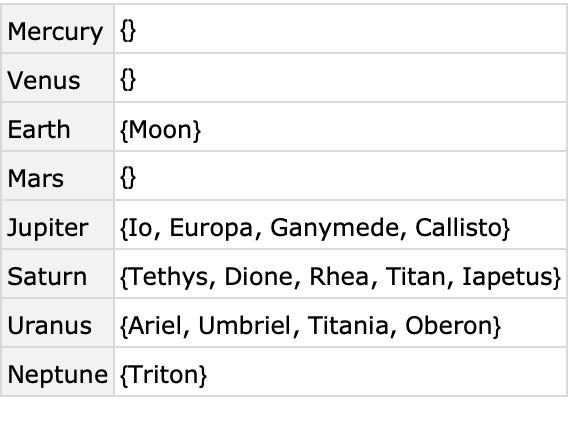
We can do computations about the moons of all planets. First, let’s just find out how many moons are listed for each planet.
In[33]:=
Out[33]=
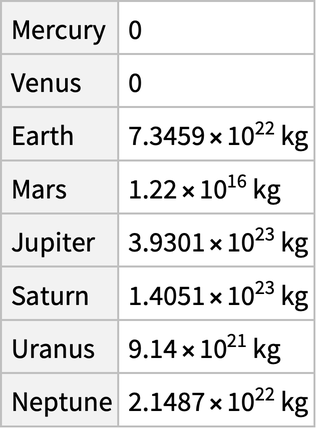
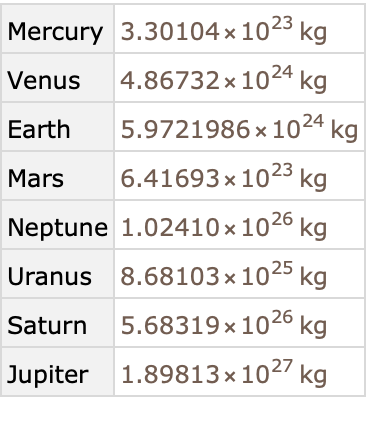
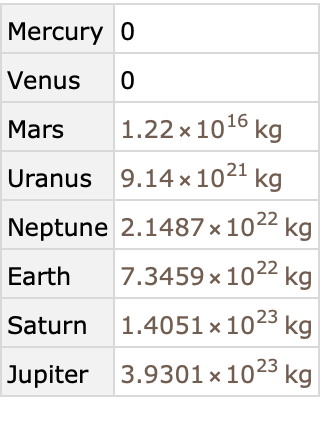
Find the total mass of all moons for each planet:
In[34]:=
Out[34]=
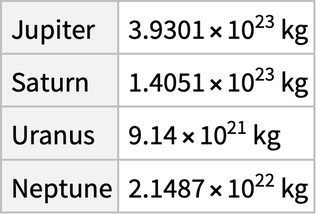
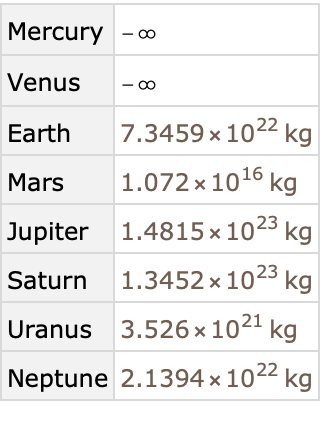
Get the same result, but only for planets with more than 10 moons:
In[35]:=
Out[35]=
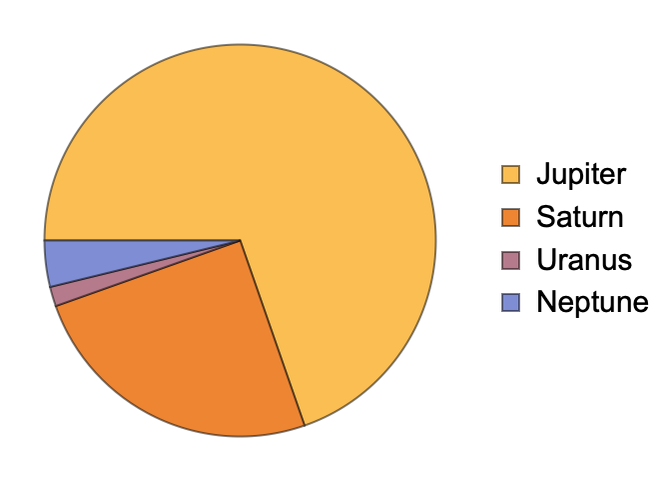
Make a pie chart of the result:
In[36]:=
Out[36]=
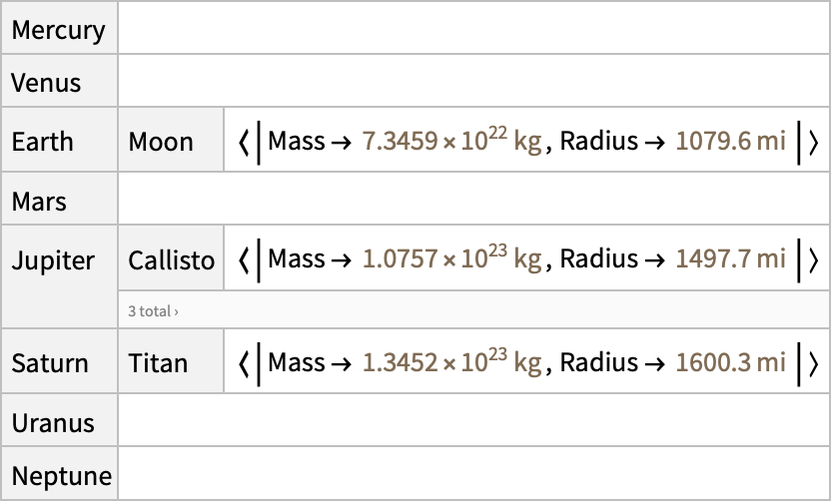
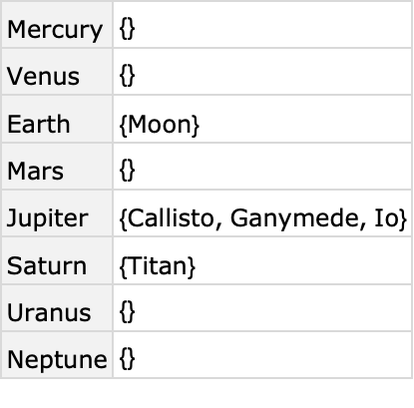
For all moons, select ones whose mass is greater than 0.01 times the mass of the Earth:
In[37]:=
Out[37]=
Get the list of keys (i.e. moon names) in the resulting association for each planet:
In[38]:=
Out[38]=
Get the underlying association:
In[39]:=
Out[39]=
Join together, or “catenate”, the lists for all keys:
In[40]:=
Out[40]=
Here’s the whole computation in one line:
In[41]:=
Out[41]=
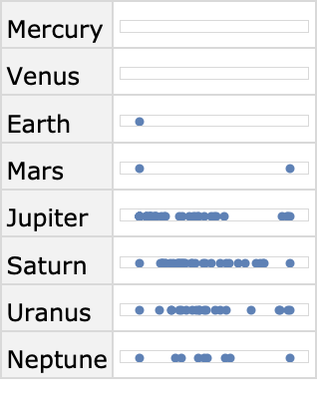
Here’s one more example, where we find the logarithm of the mass of each moon, then make a number line plot of these values for each planet.
Make number line plots of the logarithms of masses for moons of each planet:
In[42]:=
Out[42]=
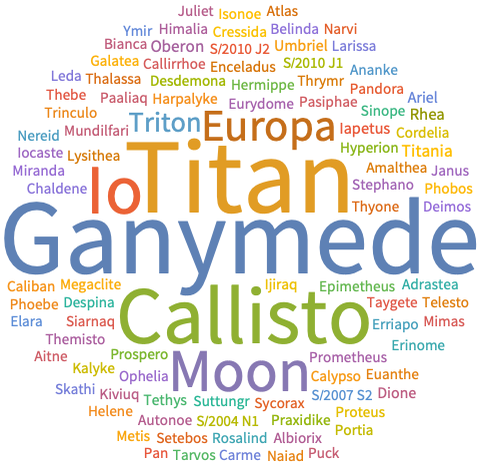
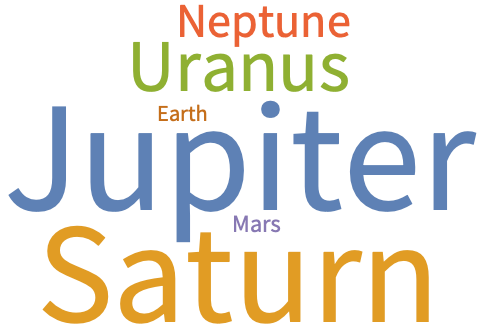
As a final example, let’s make a word cloud of names of moons, sized according to the masses of the moons. To do this, we need a single association that associates the name of each moon with its mass.
When given an association, WordCloud determines sizes from values in the association:
In[43]:=
Out[43]=
The function Association combines associations:
In[44]:=
Out[44]=
Generate the word cloud of moon masses:
In[45]:=
Out[45]=

For what it does, the code here is surprisingly simple. But we can make it slightly more streamlined by using @* or /*.
We’ve seen before that we can write something like f[g[x]] as f@g@x or x//g//f. We can also write it f[g[#]]&[x]. But what about f[g[#]]&? Is there a short way to write this? The answer is that there is, in terms of the function composition operators @* and /*.
In[46]:=
Out[46]=
In[47]:=
Out[47]=
Here’s the previous code rewritten using composition @*:
In[48]:=
Out[48]=
And using right composition /*:
In[49]:=
Out[49]=

As a final example, let’s look at another dataset—this time coming straight from the Wolfram Data Repository. Here’s a webpage (about big meteors) from the repository:
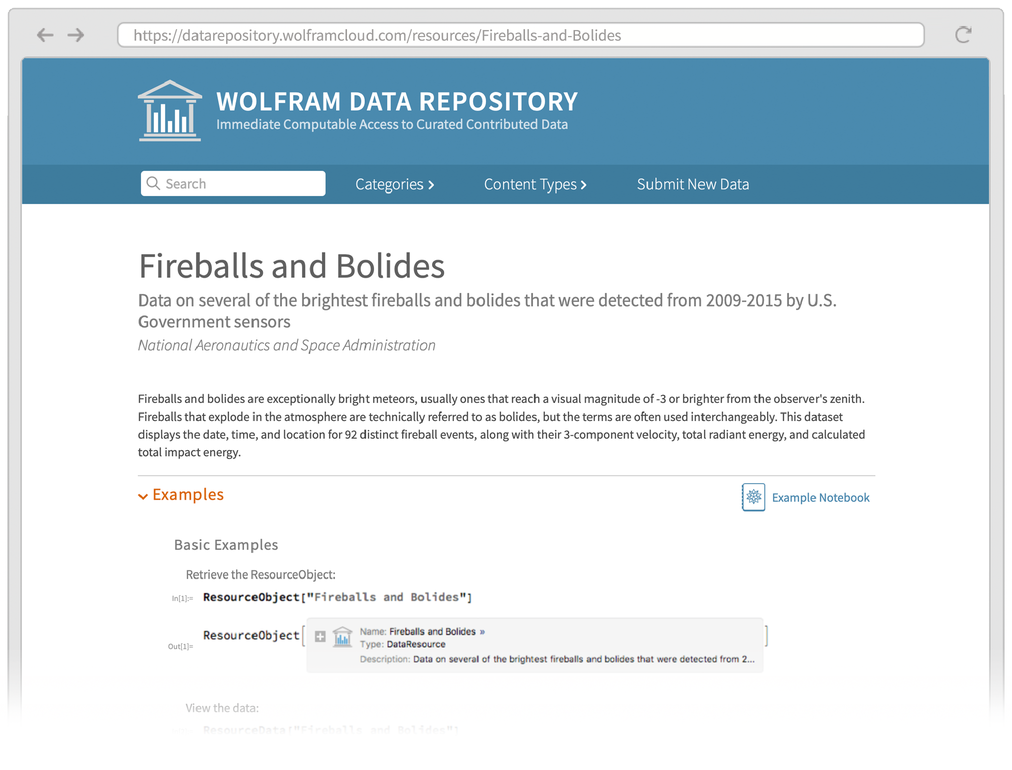
To get the main dataset that’s mentioned here, just use ResourceData.
Get the dataset just by giving its name to ResourceData:
In[50]:=
Out[50]=
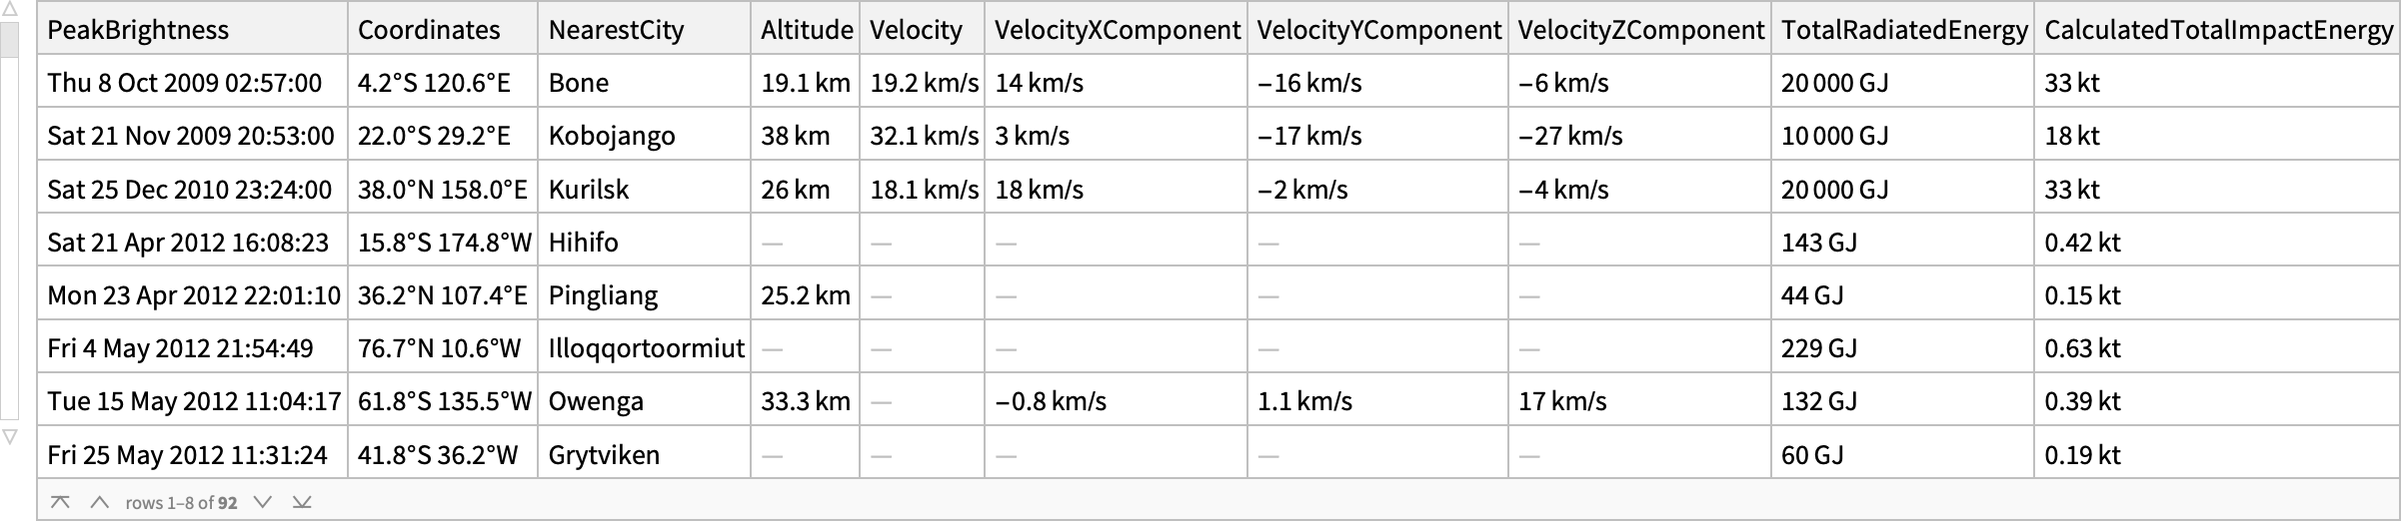
In[51]:=
Out[51]=
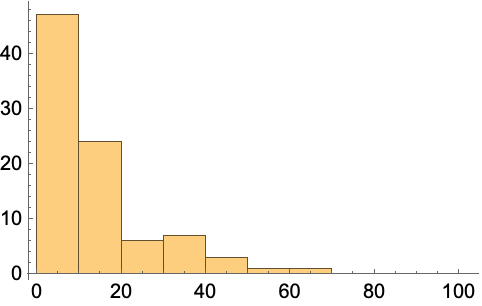
Make a histogram of the altitudes:
In[52]:=
Out[52]=

| Dataset[data] | a dataset | |
| Normal[dataset] | convert a dataset to normal lists and associations | |
| Catenate[{assoc1, ...}] | catenate associations, combining their elements | |
| f@*g | composition of functions ( f[g[x]] when applied to x) | |
| f/*g | right composition (g[f[x]] when applied to x) |
Note: These exercises use the dataset planets=CloudGet["https://wolfr.am/7FxLgPm5"].
45.1Make a word cloud of the planets, with weights determined by their number of moons. »

45.2Make a bar chart of the number of moons for each planet. »
45.3Make a dataset of the masses of the planets, sorted by their number of moons. »
45.4Make a dataset of planets and the mass of each one’s most massive moon. »
45.5Make a dataset of masses of planets, where the planets are sorted by the largest mass of their moons. »
45.6Make a dataset of the median mass of all moons for each planet. »
45.7For each planet, make a list of moons larger in mass than 0.0001 Earth masses. »
45.8Make a word cloud of countries in Central America, with the names of countries proportional to the lengths of the Wikipedia article about them. »

45.9Find the maximum observed altitude in the Fireballs & Bolides dataset. »
45.10Find a dataset of the 5 largest observed altitudes in the Fireballs & Bolides dataset. »
45.11Make a histogram of the differences in successive peak brightness times in the Fireballs & Bolides dataset. »
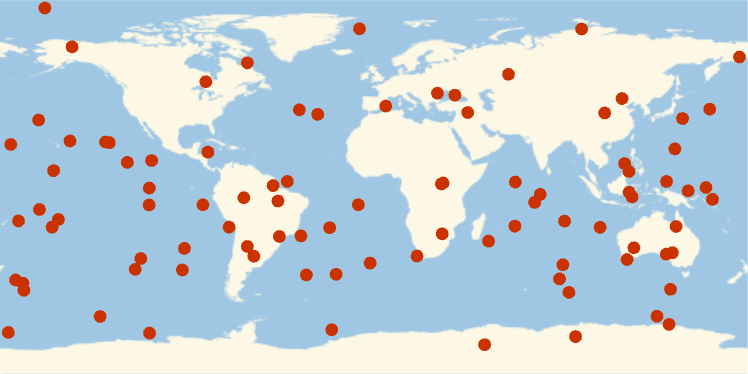
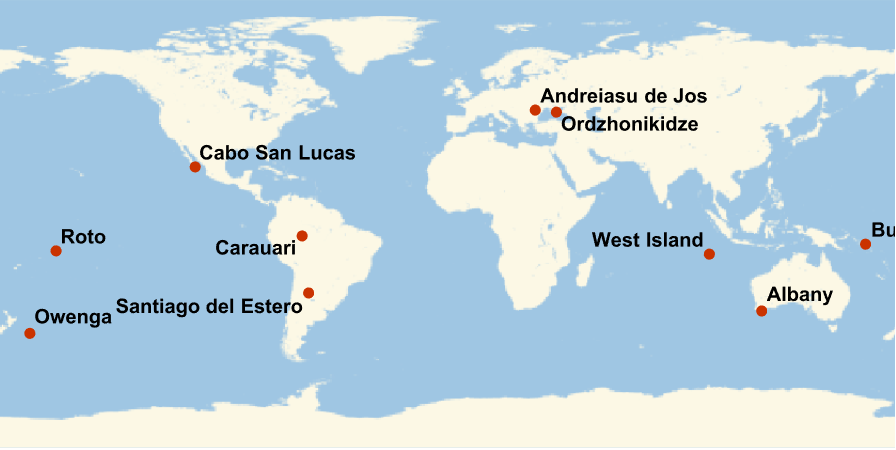
45.12Plot the nearest cities for the first 10 entries in the Fireballs & Bolides dataset, labeling each city. »
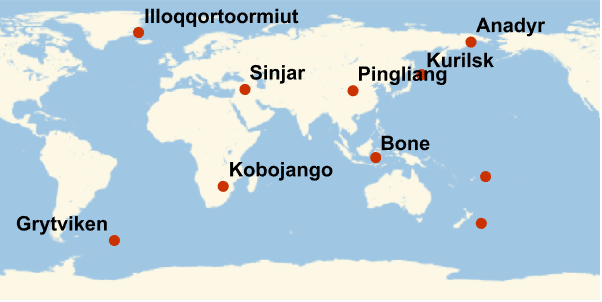
45.13Plot the nearest cities for the 10 entries with largest altitudes in the Fireballs & Bolides dataset, labeling each city. »
What kinds of data can datasets contain?
Any kinds. Not just numbers and text but also images, graphs and lots more. There’s no need for all elements of a particular row or column to be the same type.
Can I adjust the formatting of datasets?
Yes. There are many options. For example, Dataset[dataset, MaxItems → 5] will display 5 items per “page”.
Can I turn spreadsheets into datasets?
Yes. SemanticImport is often a good way to do it.
What are databases and how do they relate to Dataset?
Databases are a traditional way to store structured data in a computer system. Databases are often set up to allow both reading and writing of data. Dataset is a way to represent data that might be stored in a database so that it’s easy to manipulate with the Wolfram Language.
How does data in Dataset compare to data in an SQL (relational) database?
SQL databases are strictly based on tables of data arranged in rows and columns of particular types, with additional data linked in through “foreign keys”. Dataset can have any mixture of types of data, with any number of levels of nesting, and any hierarchical structure, somewhat more analogous to a NoSQL database, but with additional operations made possible by the symbolic nature of the language.
Can I use datasets to set up entities and values for them?
Yes. If you’ve got a dataset that’s an association of associations, with the outer keys being entities and the inner ones being properties, then you just have to put this inside EntityStore, and you’ll pretty much have everything set up.
- Dataset supports a new kind of symbolic database structure which generalizes both relational and hierarchical databases.
- Dataset has many additional mechanisms and capabilities that we haven’t discussed.
- Everything that can be done with queries on datasets can also be done by using functions like Map and Apply on underlying lists and association—but it’s typically much simpler with dataset queries.
- You can connect the Wolfram Language directly to SQL databases—and do queries with SQL syntax—using DatabaseLink.