Get started with Wolfram technologies, or work with us to apply computational expertise to your projects.
Questions? Comments? Get in touch: 1-800-WOLFRAM, or email us
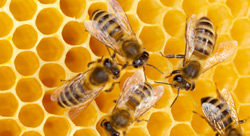
Things are always abuzz at the U.S. Department of Agriculture's Carl Hayden Bee Research Center in Tucson, Arizona, where Mathematica helps researchers analyze bee behavior.
Mathematica proved to be key in performing algebraic computations and generating graphics involved in a study of bee foraging patterns several years ago. USDA physicist Charles Shipman is one of the researchers who examined foraging distribution data to learn just how far and in what patterns bees fly to pollinate flowering plants. Results now help bee keepers determine optimal locations to place hives so farmers can obtain higher yields of crops such as almonds, melons, cotton, and citrus.
The challenge ahead lies in how to influence bee behavior. "To do this, we first have to study what stimuli elicit certain bee responses, and at what levels," explains Shipman. Equations are developed to describe a large number of input parameters and their effect on a range of behavior patterns. The equations are manipulated in Mathematica and graphic representations allow researchers to see relationships more clearly. "In some cases, these tasks would have been impossible without Mathematica, and they all would be very laborious," Shipman says.
Researchers seek to understand, for example, how 50,000 bees function together in harmony in a dark hive, and why they build combs in the shape of nearly perfect hexagons with smooth surfaces and a trihedral apex configuration at the base. "This involves theoretical investigations into what happens between the translation of environmental and internal sensory inputs into spatial-temporal configurations of electrical activity within the nervous system and these kinds of activities," says Shipman.
"Other studies where Mathematica proved to be key have involved computer simulations of a bumble bee's movements as it vibrates a flower to release pollen. These simulations help us understand buzz pollination of tomato plants and other crops," says Shipman. "In another study, Mathematica helped us analyze light diffraction patterns so we can better identify how bees see."
Mention of a trade name or proprietary product does not constitute endorsement by the USDA-ARS for its use over that of any other like product.