Graphics & Visualization
Interactively Explore Prices and Indicators
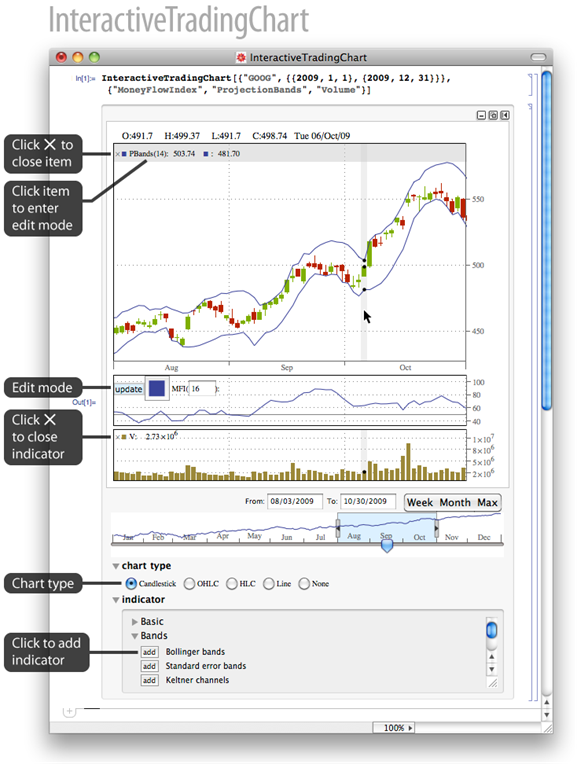
Create trading charts that allow the date range to be varied and indicators to be interactively added, removed, and customized.
 |
| New in Wolfram Mathematica 8: Financial Visualization | ◄ previous | next ► |
|