New in Wolfram
Mathematica
8: Parametric Probability Distributions
◄
previous
|
next
►
Core Algorithms
Multivariate Distributions
Multivariate continuous and discrete parametric distributions in
Mathematica
8.
In[1]:=
X
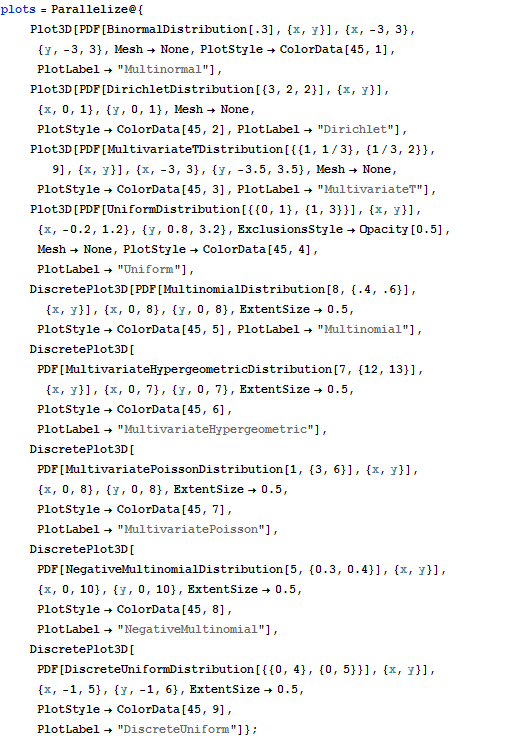
plots = Parallelize@{ Plot3D[ PDF[BinormalDistribution[.3], {x, y}], {x, -3, 3}, {y, -3, 3}, Mesh -> None, PlotStyle -> ColorData[45, 1], PlotLabel -> "Multinormal"], Plot3D[ PDF[DirichletDistribution[{3, 2, 2}], {x, y}], {x, 0, 1}, {y, 0, 1}, Mesh -> None, PlotStyle -> ColorData[45, 2], PlotLabel -> "Dirichlet"], Plot3D[ PDF[MultivariateTDistribution[{{1, 1/3}, {1/3, 2}}, 9], {x, y}], {x, -3, 3}, {y, -3.5, 3.5}, Mesh -> None, PlotStyle -> ColorData[45, 3], PlotLabel -> "MultivariateT"], Plot3D[ PDF[UniformDistribution[{{0, 1}, {1, 3}}], {x, y}], {x, -0.2, 1.2}, {y, 0.8, 3.2}, ExclusionsStyle -> Opacity[0.5], Mesh -> None, PlotStyle -> ColorData[45, 4], PlotLabel -> "Uniform"], DiscretePlot3D[ PDF[MultinomialDistribution[8, {.4, .6}], {x, y}], {x, 0, 8}, {y, 0, 8}, ExtentSize -> 0.5, PlotStyle -> ColorData[45, 5], PlotLabel -> "Multinomial"], DiscretePlot3D[ PDF[MultivariateHypergeometricDistribution[7, {12, 13}], {x, y}], {x, 0, 7}, {y, 0, 7}, ExtentSize -> 0.5, PlotStyle -> ColorData[45, 6], PlotLabel -> "MultivariateHypergeometric"], DiscretePlot3D[ PDF[MultivariatePoissonDistribution[1, {3, 6}], {x, y}], {x, 0, 8}, {y, 0, 8}, ExtentSize -> 0.5, PlotStyle -> ColorData[45, 7], PlotLabel -> "MultivariatePoisson"], DiscretePlot3D[ PDF[NegativeMultinomialDistribution[5, {0.3, 0.4}], {x, y}], {x, 0, 10}, {y, 0, 10}, ExtentSize -> 0.5, PlotStyle -> ColorData[45, 8], PlotLabel -> "NegativeMultinomial"], DiscretePlot3D[ PDF[DiscreteUniformDistribution[{{0, 4}, {0, 5}}], {x, y}], {x, -1, 5}, {y, -1, 6}, ExtentSize -> 0.5, PlotStyle -> ColorData[45, 9], PlotLabel -> "DiscreteUniform"]};
In[2]:=
X
Grid[Partition[plots, 3]]
Out[2]=