Exploring Statistics of Beta Sites of the StackExchange Network
This example compares beta sites on the StackExchange Q&A portal.
Load RLink.
| In[1]:= | X |
Start with some data, which was originally also obtained by running a Mathematica script to query the sites of StackExchange.
| In[2]:= | 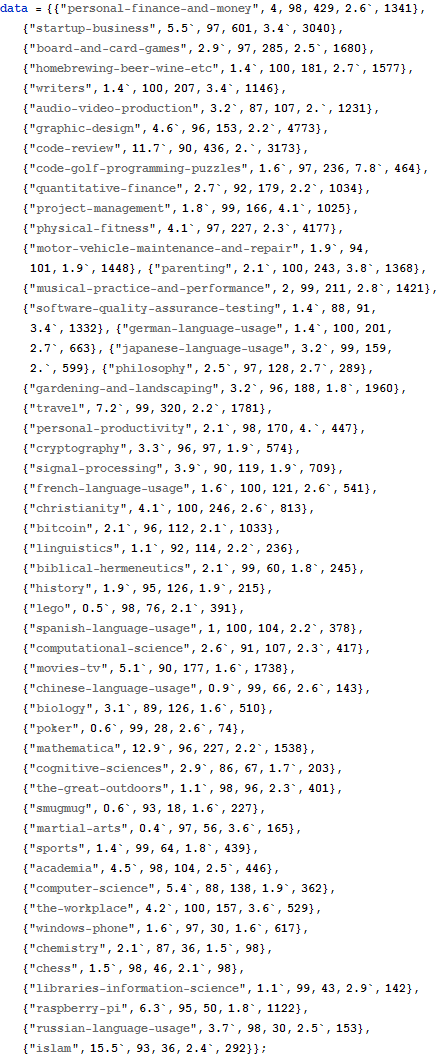 X |
Each row contains the name of the site, average number of questions per day, percentage of answered questions, number of avid users, average ratio of answers to questions, and average number of daily visits.
Export this data to a file.
| In[3]:= | 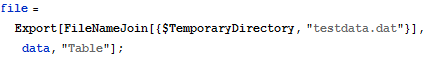 X |
Send the file name to R.
| In[4]:= | X |
| Out[4]= |
Read the data.
| In[5]:= | X |
Add names to columns.
| In[6]:= | 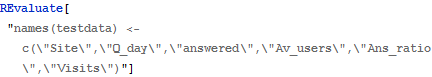 X |
| Out[6]= |
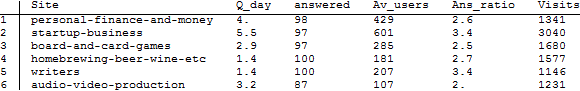
Display the first few rows.
| In[7]:= | X |
| Out[7]//TableForm= |
 |
This shows how the convenience of Mathematica's interactivity can be combined with R's processing of tabular data. Construct a filtering function that allows filtering of data according to thresholds on values of various columns, and sort the data with respect to any single column.
| In[8]:= | 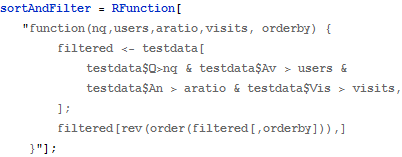 X |
Define the Mathematica dynamic interface.
| In[9]:= | 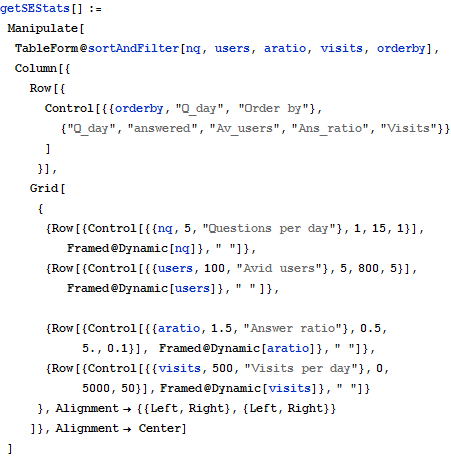 X |
Now start exploring the data. The sliders control thresholds for each of the column values, and the buttons allow you to order the results according to the specific column values.
| In[10]:= | X |
| Out[10]= | 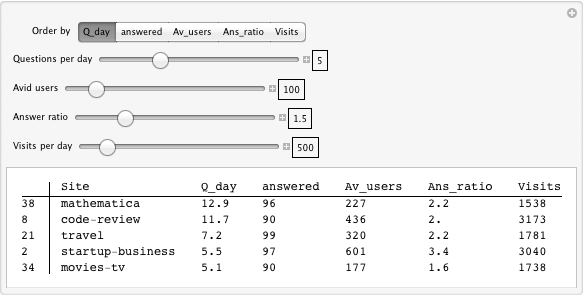 |