Compare Survival Rates of Treatment and Control Groups
Use SurvivalModelFit to visually compare survival curves with confidence bands for treatment and control groups.
| In[1]:= | 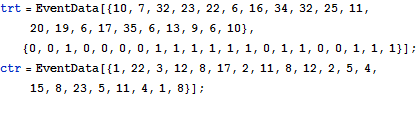 X |
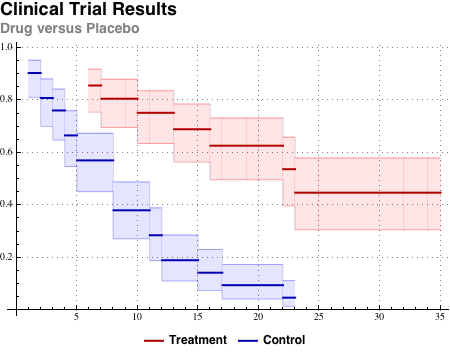 |
Gehan's weighted LogRankTest agrees with the visual that there is a significant difference in the hazard rates.
| In[2]:= | X |
| Out[2]= |