| New in Wolfram Mathematica 6: Dynamic Interactivity | ◄ previous | next ► |
Immediately Visualize Classic Phenomena
Mathematica 6 makes it unprecedentedly easy to create compelling interactive visualizations.

In[1]:= | 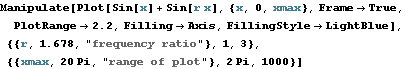 Manipulate[
Plot[Sin[x] + Sin[r x], {x, 0, xmax}, Frame -> True,
PlotRange -> 2.2, Filling -> Axis,
FillingStyle -> LightBlue], {{r, 1.678, "frequency ratio"}, 1,
3}, {{xmax, 20 Pi, "range of plot"}, 2 Pi, 1000}] |
Out[1]= |