| New in Wolfram Mathematica 6: Symbolic Report Generation | ◄ previous | next ► |
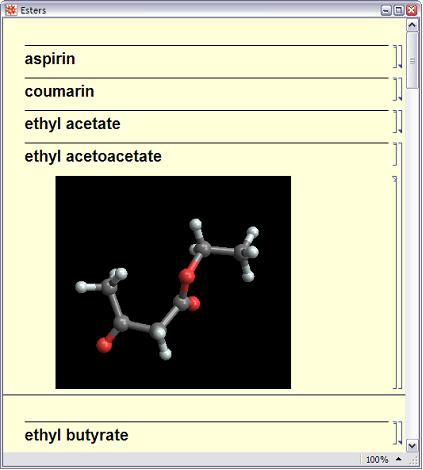
Create Reports with Active 3D Graphics
Mathematica 6 lets you immediately create reports that contain fully manipulable and editable graphics.

In[1]:= |  CreateDocument[
CellGroup[{TextCell[ChemicalData[#, "Name"], "Section"],
ExpressionCell[
Quiet[Show[ChemicalData[#, "MoleculePlot"],
Background -> Black]], "Output"]}, Closed] & /@
ChemicalData["Ester"], WindowTitle -> "Esters",
Background -> LightYellow] |
 |