SectorChart[data, SectorOrigin -> {Automatic, 15000},
LabelingFunction -> (Placed[#, Tooltip,
Style[Column[{Row[{"GDP: ", dollarForm[First@#*Last@#]}],
Row[{"Population: ",
NumberForm[First@#, {10, 2}, NumberPadding -> {"", "0"}]}],
Row[{"GDP Per Capita: ", dollarForm[First@#]}]},
Alignment -> {Left, Bottom}, Frame -> True], 14,
FontFamily -> "Helvetica"] &] &), ChartStyle -> 2,
ChartLabels ->
Placed[countries, "RadialCallout",
Style[#, 12, FontFamily -> "Helvetica", Darker@Brown] &],
PlotLabel ->
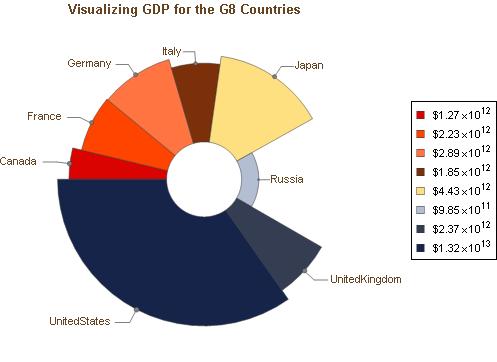
Style["Visualizing GDP for the G8 Countries", 14, Bold,
FontFamily -> "Helvetica", Darker@Brown], PlotRange -> All,
ChartLegends ->
Placed[gdp, Right,
Style[dollarForm[#], FontFamily -> "Helvetica"] &]]