New in Wolfram Mathematica 7: Current & Historical Weather Data  previous | next 
Compare Temperatures for Different Years
Monthly temperatures in Albuquerque, New Mexico in 1950, 1975, and 2000.
In[1]:=

Click for copyable input
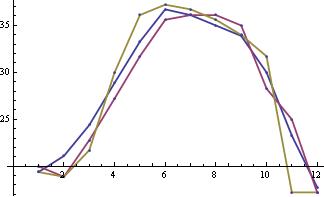
ListPlot[WeatherData["KABQ", "MaxTemperature", {{#}, {#}, "Month"}, 

    "Value"] & /@ Range[1950, 2000, 25] , Joined -> True , 

 PlotStyle -> Thick, Mesh -> All]
Out[1]=