New in Wolfram Mathematica 7: Current & Historical Weather Data  previous | next 
Generate Maps of Current Wind Patterns
This generates a stream plot of wind patterns over the US, based on real-time samples at a grid of points.
In[1]:=

Click for copyable input
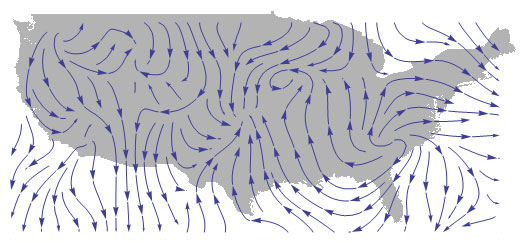
Show[Graphics[{GrayLevel[.7], CountryData["USA", "Polygon"]}], 

 ListStreamPlot[

  Table[{{x, y}, 

    -Through[{Sin, Cos}[

      WeatherData[{y, x}, 

        "WindDirection"] \[Degree]]]}, {x, -125, -67, 4}, {y, 24, 50, 

    4}]]]
Out[1]=