 Data Science
Employ a multiparadigm approach for your data science projects. Develop modular, flexible and scalable workflows to import, process, analyze and visualize data. Learn about easy-to-use functions, repositories, frameworks and interfaces while applying algorithms and techniques from across multiple disciplines.
These courses showcase some of the computational processes driving data analysis and visualization, the application of automated machine learning tools and the use of natural language queries within a symbolic framework. Topics covered also include the use of interactive Wolfram Notebooks and the cloud for generating reports and deploying data products. Earn course completion certificates and work toward Level 1 and Level 2 data science certifications.
Upcoming Events
-

Dec 10 | Online
Mastering Relational Databases with Wolfram Language and SQL
Learn how to run SQL code directly from Wolfram Language to perform basic create, read, update and delete operations, and also how to map your tables to Wolfram's Entity framework for more powerful symbolic queries and data-driven business insights.
See Details and Register
Feb 3 | Online
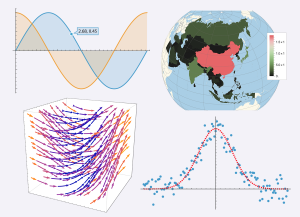
Function and Data Visualization: A Showcase of Plots, Charts and Graphics
Expand your skills for visualizing mathematical functions and improve your ability to represent different types of data with plots, charts and graphics of all kinds. This course shows how to customize visualizations and plots with options, add labels and legends and even make them dynamic and interactive.
See Details and Register
Feb 5 | Online
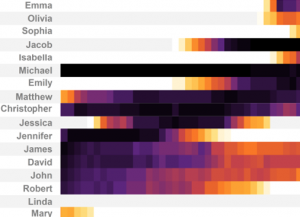
Data Visualization with Wolfram Language
This course shows how to quickly visualize different data structures and how to make your graphics ready to publish and share. Domain-specific functions as well as general techniques are shared for getting the most out of your graphics.


