Get started with Wolfram technologies, or work with us to apply computational expertise to your projects.
Questions? Comments? Get in touch: 1-800-WOLFRAM, or email us

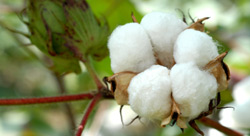
Cotton: "The fabric of our lives"® Whether it's a fluffy soft pillowcase, or your toughest, most durable jeans, the TV ads make it all look so clean and simple. But testing and evaluating nearly all cotton grown in the U.S—about 17 million bales of it a year—requires some pretty sophisticated technology, Mathematica included.
Eddie R. Riddle at Cotton Incorporated relies on Mathematica for help in a variety of cotton-fiber research projects. One involves studying the calibration of USDA cotton testing machines.
Data on fiber qualities such as strength, length, uniformity, and density is collected year-round on nearly every bale of U.S.-grown cotton. As part of a USDA Agricultural Marketing Service (ASM) Cotton Division (CD) program, samples of this data are then sent to Riddle's department for real-time decision-making analysis. Riddle developed a system that uses Mathematica to perform statistics operations and Fourier analysis, and then creates reports that contain Mathematica-generated graphics along with numerical results. These reports are returned electronically in real time.
"This system ensures that the equipment is calibrated properly," explains Riddle. "That helps the USDA assign cotton property values with a higher level of precision, and helps cotton growers accurately judge the quality of their crops."
"As the computational engine of this calibration system, Mathematica has been particularly useful for advanced statistics computations and its ability to display data graphically. Having the graphics in PostScript format means it's easy to resize them for our final reports."