Get started with Wolfram technologies, or work with us to apply computational expertise to your projects.
Questions? Comments? Get in touch: 1-800-WOLFRAM, or email us

Develop a new economic indicator to predict the health of the US economy.
Use Mathematica exclusively to implement the X-12 ARIMA model, analyze time series data, and visualize results.
In recent years, predicting the health of the US economy has become more complicated than ever. Kronos, a provider of workforce management software to a significant portion of the US retail sector, uses Mathematica and a unique data source to create the Kronos Retail Labor Index, a leading economic indicator of the health of the US economy.
"During the past several decades, the US economy has moved from a goods-based economy, where the largest percentage of US gross domestic product (GDP) was accounted for by goods absorbed in a physical infrastructure (public and private), to one where US consumers and their inclination to spend discretionary disposable income has become the driving factor in economic growth," said Dr. Robert P. Yerex, chief economist at Kronos. Leading indicators based on physical supply chain dynamics, such as inventory levels, have become less reliable and useful, especially as manufacturers have begun to move to just-in-time (JIT) manufacturing processes. As an emerging services economy, a large percentage of commerce is now tied to the provisioning of services rather than physical goods, and labor now accounts for more than 60% of the cost of operations in the typical US firm. That number is much higher in service-intensive industries such as retail, dining, hospitality, and healthcare.
All these changes have created a pressing need for new models to track the state of the US economy.
One potential area for discovering leading indicators is in the dynamics of the labor market. Kronos has immediate, direct access to the employee-hiring and -retention statistics of a large sector of the US retail market.
Founded in 1977 and headquartered in Massachusetts, Kronos offers a wide variety of workforce management solutions to a large portion of the US retail market. One particular area of focus is employee selection and onboarding. Kronos has processed more than 80 million applications, with 1 job application being processed every 2 seconds. This provides Kronos with a unique, independent source of data not subject to revisions or survey sampling errors.
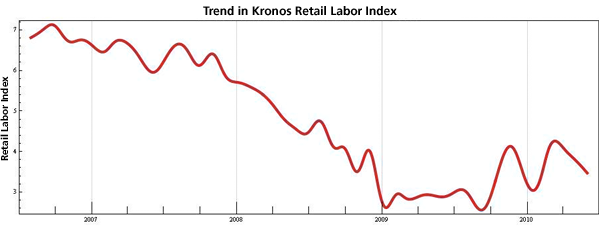
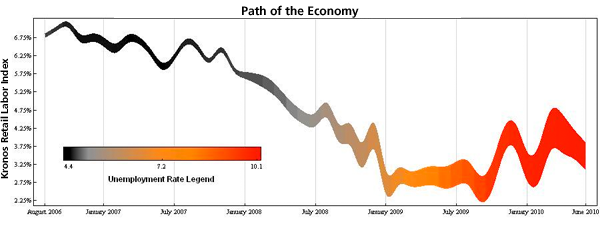
The Kronos Retail Labor Index quantifies the relationship between retail hiring trends and other measurements of the economy with the hypothesis that it can be used as a leading indicator. Dr. Yerex used Mathematica exclusively in the development of the Kronos Retail Labor Index, and continues to use it in the monthly Index production.
Data for determining the Index is obtained from the Kronos system and represents the application and hiring transactions from 69 US retail firms—approximately 15% of the US retail labor market. The vast amount of data (about 30 million applications a year) is stored in an SQL database. Since Mathematica has built-in support for many databases, including MySQL, Open Database Connectivity (ODBC), and HSQLDB, Yerex said it was easy for him to retrieve the data. He then analyzed the data with Mathematica.
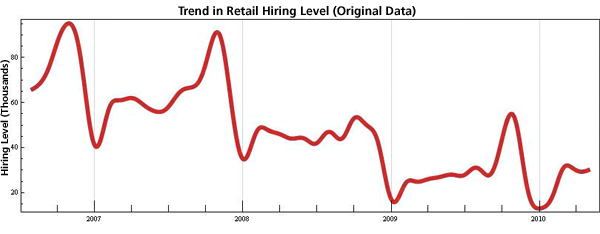
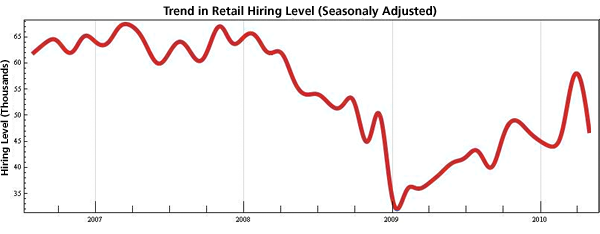
The demand for labor within the US retail market is very seasonal and analysis of economically related time series requires specialized forms of seasonal adjustment. Yerex used Mathematica for time series analysis and to remove the seasonality. "The ability to write the equations symbolically and solve them numerically was very helpful and saved me a lot of time," said Yerex. Here, a time series is defined to have seasonality if its sample autocorrelation function (ACF) has significant values at multiples of the seasonal period (e.g. in the case of monthly data, as we have here, at lags 12, 24, etc.) A visual inspection of the normalized level of hiring indicates a significant seasonal effect that is most pronounced in January and July.

Yerex used the Box–Jenkins approach for seasonal adjustment. In this approach, seasonality is understood to be the dominant non-stationary factor, and because the period of seasonality is often known, it is a fairly straightforward adaptation of the well-known autoregressive integrated moving average (ARIMA) model.
After exhaustive comparisons of various ARIMA models for use with the Index data, and with the selection criteria being the greatest reduction in ACF and the Kruskal–Wallis coefficient, Yerex found the X-12 ARIMA model of the US Census Bureau to be the most appropriate model. He implemented the X-12 model using Mathematica even though the US Census Bureau provides the X-12-ARIMA Seasonal Adjustment Program as a public domain software to analyze very large time series. He says, "While it would be possible to use the software provided by the Census Bureau, doing so would not allow for integration with a number of other procedures developed for the analysis of the data and for graphical display of results. Mathematica graphics are fantastic. I've never been able to do the same using any other software."

The Kronos Retail Labor Index is calculated simply as the ratio of hires to applications. Since the time series for the hires and applications have different seasonal characteristics, they are adjusted for seasonality separately.


The Kronos Retail Labor Index, built exclusively using Mathematica, is produced monthly and is an exciting new leading economic indicator of the overall health of the US economy. Yerex says Mathematica's ability to provide one central location to do algorithm development, time series analysis, and graphically display the results has improved his efficiency tremendously.