How Much Does It Weigh?
The weight of an object in a gravitational field is the product of its mass and the value of the gravitational field at the position of the object. On the surface of the Earth, the gravitational field is not constant, and therefore the same object has a different weight at different locations. This example explores the variability of the magnitude of the gravitational field with elevation and latitude.
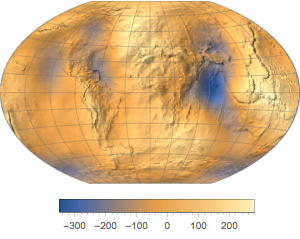
GeogravityModelData computes several properties of the Earth's gravitational field at a given location.
GeogravityModelData[GeoPosition[{0, 0}]]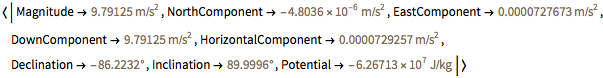
It uses topographic elevation provided by GeoElevationData.
GeoElevationData[GeoPosition[{0, 0}]]Ignoring other effects, the gravitational field is generally smaller for a location with similar latitude but higher elevation.
GeoPosition[Entity["City", {"Quito", "Pichincha", "Ecuador"}]]GeoPosition[Entity["City", {"Quito", "Pichincha", "Ecuador"}]];
{GeoElevationData[%, UnitSystem -> "Metric"],
GeogravityModelData[%, "Magnitude"]}Compute values of the gravitational field magnitude at equidistant points on the equator.
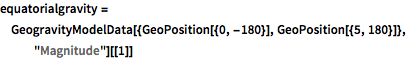
equatorialgravity =
 GeogravityModelData[{GeoPosition[{0, -180}], GeoPosition[{5, 180}]},
   "Magnitude"][[1]]
ListPlot[equatorialgravity, Joined -> True]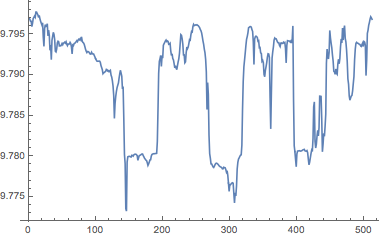
In the following histogram, there are two main peaks, corresponding to land areas and to the bottom of the oceans.
Histogram[equatorialgravity, 20]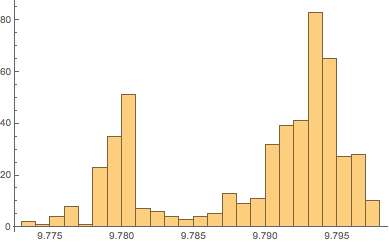
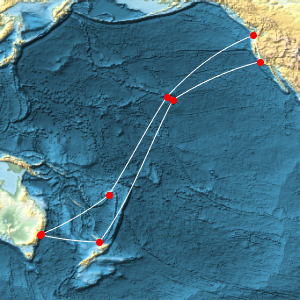
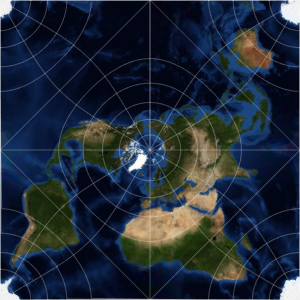
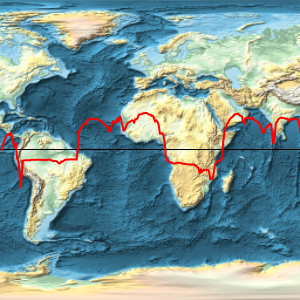
Overlay the magnitude of the gravitational field on a relief map of the Earth.
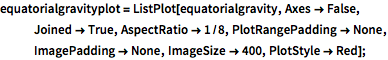
equatorialgravityplot =
  ListPlot[equatorialgravity, Axes -> False, Joined -> True,
   AspectRatio -> 1/8, PlotRangePadding -> None, ImagePadding -> None,
ImageSize -> 400, PlotStyle -> Red];worldmap =
GeoGraphics[GeoPath["Equator"], GeoRange -> "World",
ImageSize -> 400, GeoBackground -> "ReliefMap"];Overlay[{worldmap, equatorialgravityplot}, Alignment -> Center]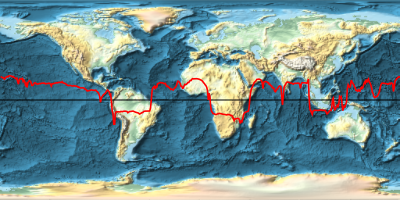
To show the variability with latitude, average the gravity field magnitude over longitude and represent the result against latitude.
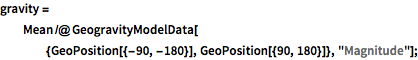
gravity =
  Mean /@ GeogravityModelData[{GeoPosition[{-90, -180}],
     GeoPosition[{90, 180}]}, "Magnitude"];
Antarctica has an obvious effect for low latitudes, due to the added elevation.
ListPlot[gravity, DataRange -> {-90, 90}]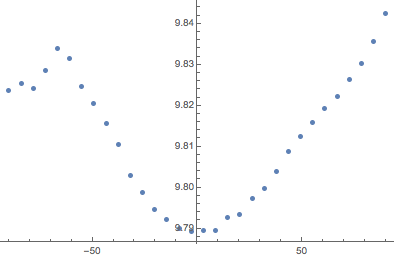
MinMax[gravity]Therefore, there can be changes of the order of 0.5% in the weight of a given object, depending on where it is measured.
MinMax[gravity];
1 - First[%]/Last[%]