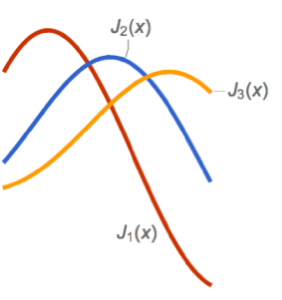
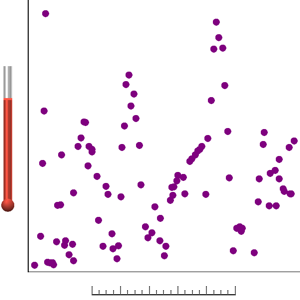
Étiquetage automatique de données
ListPlot et les fonctions connexes prennent désormais en charge LabelingFunction.
Afficher l'entrée complète de Wolfram Language
Lorsque les métadonnées appropriées sont présentes, LabelingFunction les utilise automatiquement comme des étiquettes.
In[2]:=
months = {"Jan", "Feb", "Mar", "Apr", "May", "Jun", "Jul", "Aug",
   "Sep", "Oct", "Nov", "Dec"};
In[3]:=
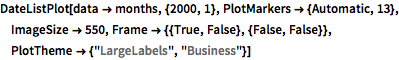
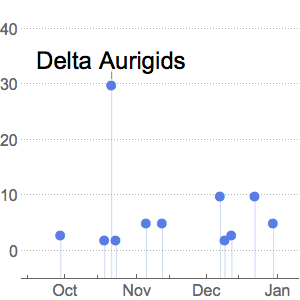
DateListPlot[data -> months, {2000, 1},
 PlotMarkers -> {Automatic, 13}, ImageSize -> 550,
 Frame -> {{True, False}, {False, False}},
 PlotTheme -> {"LargeLabels", "Business"}]
Out[3]=

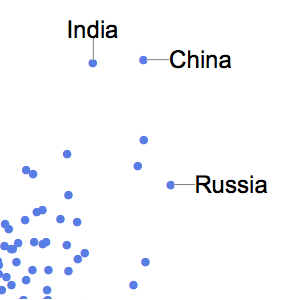
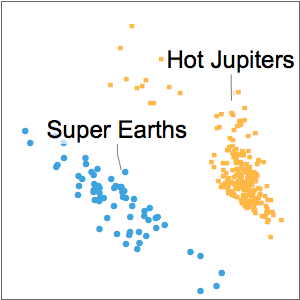
Utilisez Callout dans LabelingFunction.
In[4]:=
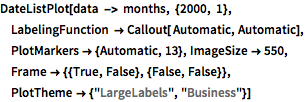
DateListPlot[data -> months, {2000, 1},
 LabelingFunction -> Callout[ Automatic, Automatic],
 PlotMarkers -> {Automatic, 13}, ImageSize -> 550,
 Frame -> {{True, False}, {False, False}},
 PlotTheme -> {"LargeLabels", "Business"}]
Out[4]=

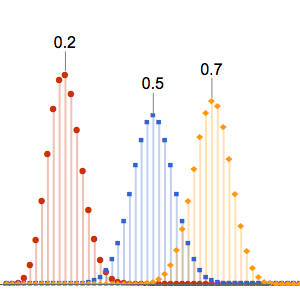
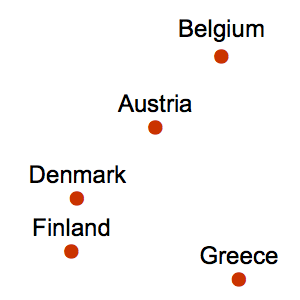
Placez les étiquettes au centre de l'endroit où se trouvent les données.
In[5]:=
opts = {PlotTheme -> {"LargeLabels", "Marketing"}, ImageSize -> 550,
   Frame -> {{True, False}, {False, False}},
   PlotRangePadding -> Scaled[.05],
   Frame -> {{True, False}, {False, False}}};
In[6]:=
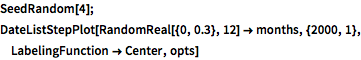
SeedRandom[4]; DateListStepPlot[
 RandomReal[{0, 0.3}, 12] -> months, {2000, 1},
 LabelingFunction -> Center, opts]
Out[6]=