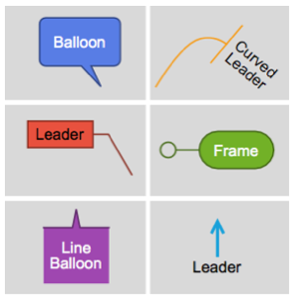
Point-Feature Labeling System
Labeling scattered points with labels of varying lengths can be challenging if done manually. The new labeling system provides an automatic solution.
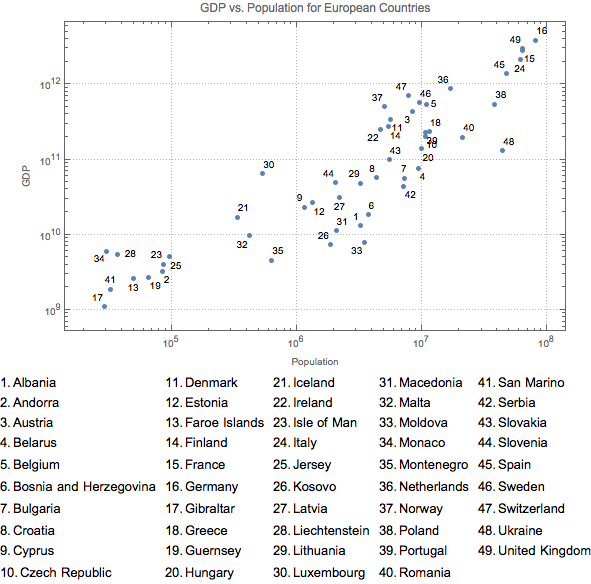
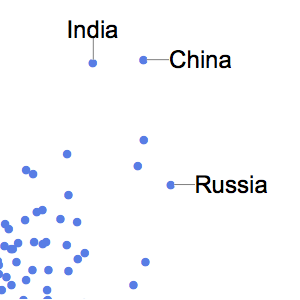
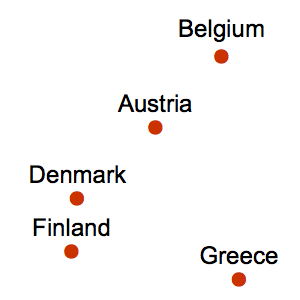
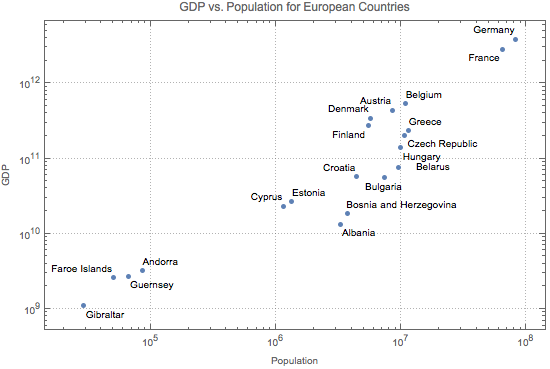
Here is an example plotting GDP versus population for all European countries.
show complete Wolfram Language input
Copy to clipboard.
In[2]:=
✖
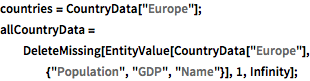
countries = CountryData["Europe"];
allCountryData =
  DeleteMissing[
   EntityValue[CountryData["Europe"], {"Population", "GDP", "Name"}],
   1, Infinity];
Show 20 examples with automatic point-feature labeling.
Copy to clipboard.
In[3]:=
✖
ListLogLogPlot[
 allCountryData[[1 ;; 20, {1, 2}]] ->
  allCountryData[[1 ;; 20, 3]], options]
Out[3]=
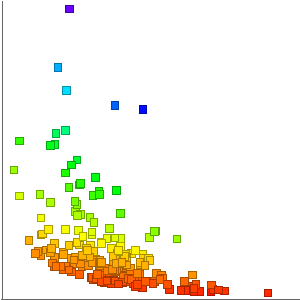
When the points are too concentrated and too many, using labels combined with a legend can work well.
Copy to clipboard.
In[4]:=
✖
legend = Multicolumn[
   Table[Text@
     Row[{ToString[i] <> ".", allCountryData[[i]][[3]]}, " "], {i,
     Length[allCountryData]}], 5];
Copy to clipboard.
In[5]:=
✖
Legended[ListLogLogPlot[allCountryData[[All, {1, 2}]],
  LabelingFunction -> (First@#2 &), options], Placed[legend, Bottom]]
Out[5]=