- Apply arbitrary scaling functions to any dimension in contour, density, surface and discrete plots. »
- Plots automatically adjust their settings based on the scaling functions.
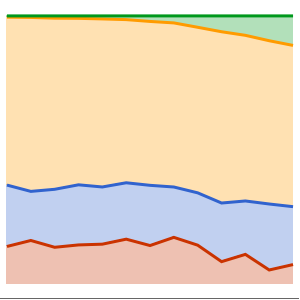
- Use stacked and percentile plot layouts to see how sets of data relate to the whole. »
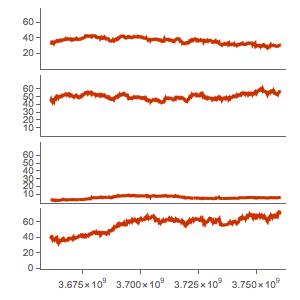
- Create grids of plots with shared axes to make individual components easier to read. »
- Improved alignment of arbitrary plots in grids. »
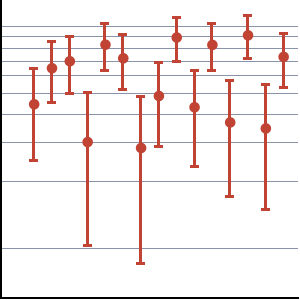
- Add error bars to plots and charts using a variety of uncertainty representations. »
- Draw uncertain values as bars, bands or ellipses. »
- Simplified styling of points, vectors and streamlines using improved markers. »