Wolfram Language

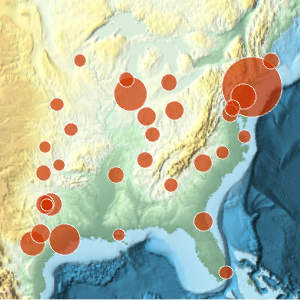
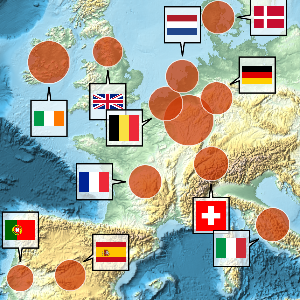
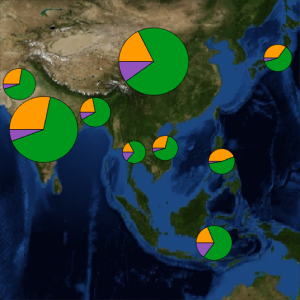
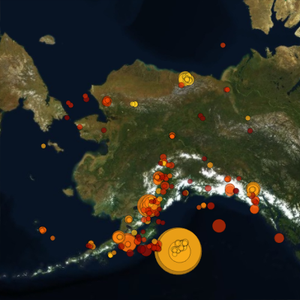
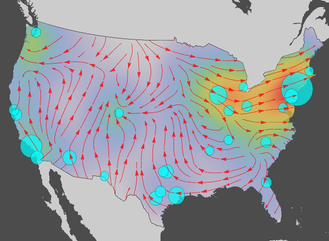
  • Display values on a map as bubbles scaled according to the values. »
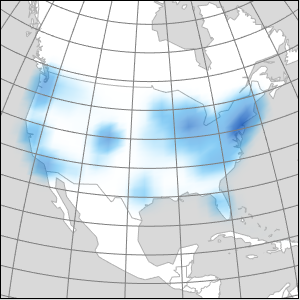
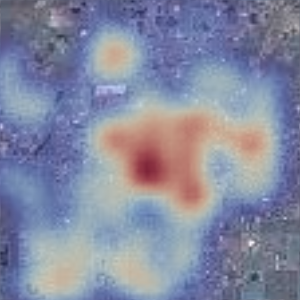
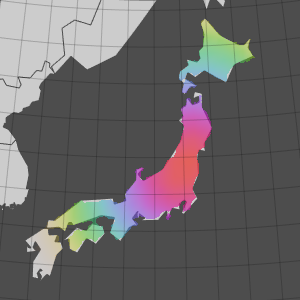
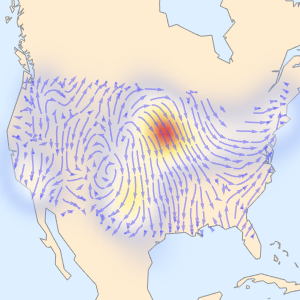
  • Show the distribution of points using smoothly varying color densities. »
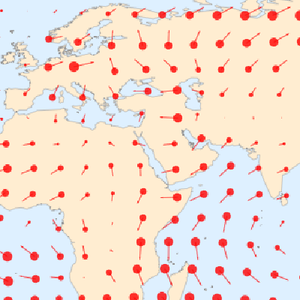
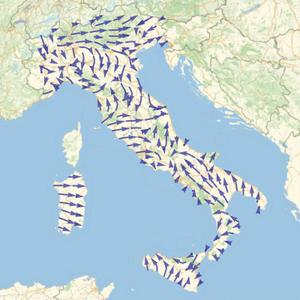
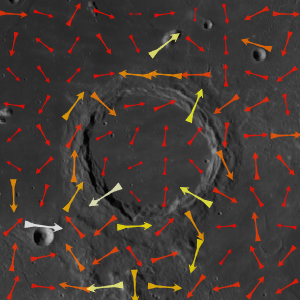
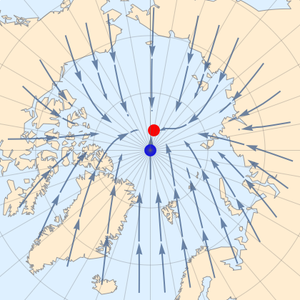
  • Plot vector fields on the Earth as discrete vectors. »
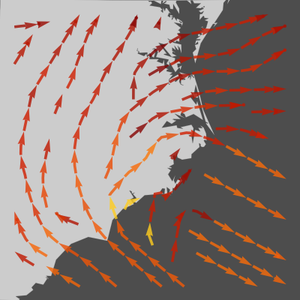
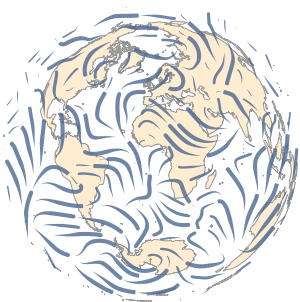
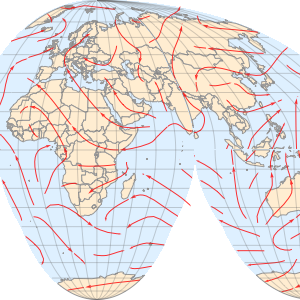
  • Use continuous streamlines to show vector fields on the Earth. »
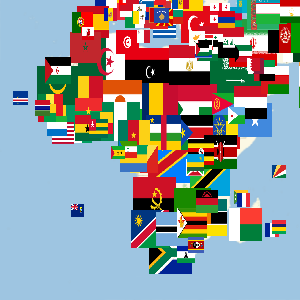
  • Use arbitrary content as bubbles to show more information. »
  • Customize the color and opacity scales used to display densities.
  • Use a wide variety of built-in markers for vectors and streamlines. »
  • Easily restrict visualization to specific countries and other regions. »
  • Create maps using a wide range of map projections. »
  • Plot features on moons and other planets.

Related Examples

Related Functions

Related Guides

See Also New in 12

Find out if you already have access to Wolfram tech through your organization
×