Carbon Atomic Transitions within the Visible Spectrum
SpectralLineData provides information about atomic states and state transitions, including wavelength.
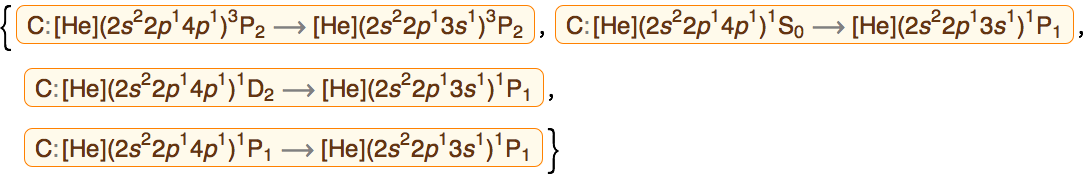
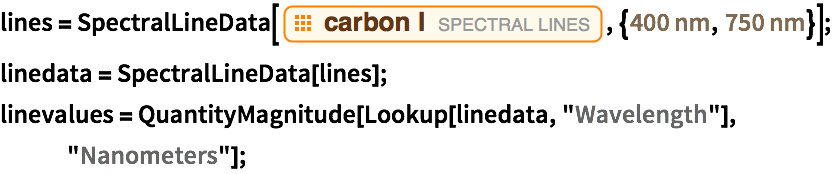
Get a list of state transitions in neutral carbon for wavelengths between 400 and 550 nanometers.
In[1]:=1
✖
Out[1]=1
Check the wavelength of the first of these transitions.
In[2]:=2
✖
Out[2]=2
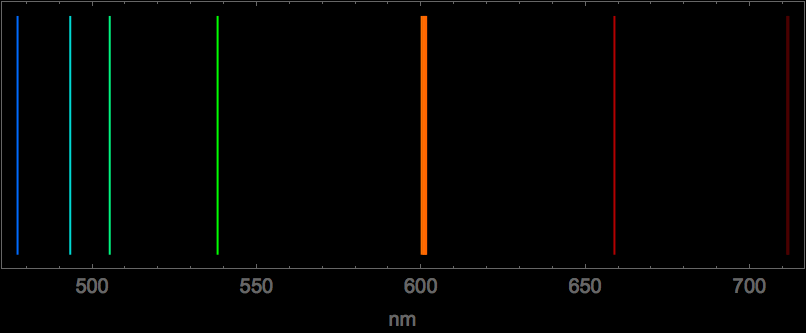
By extracting the wavelength for carbon transitions within a certain range, one can then visualize the transitions on the visible spectrum.
In[3]:=3
✖
In[4]:=4
✖
Out[4]=4
Extract the upper and lower levels for each transition.
In[5]:=5
✖
A wealth of information can be obtained for each atomic level.
In[6]:=6
✖
Out[6]=6
In[7]:=7
✖
Out[7]=7

Gather energy information for each atomic level.
In[8]:=8
✖
In[9]:=9
✖
Determine the colors for each transition.
In[10]:=10
✖
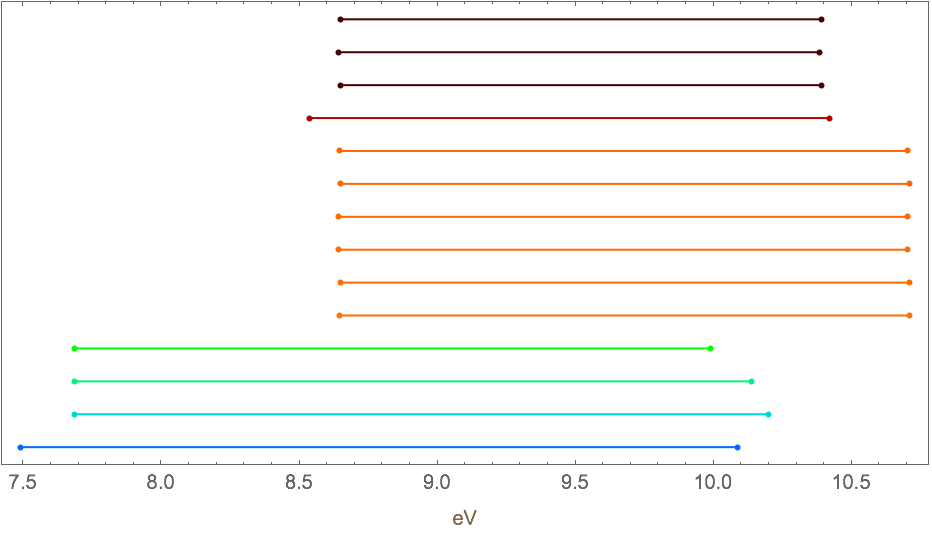
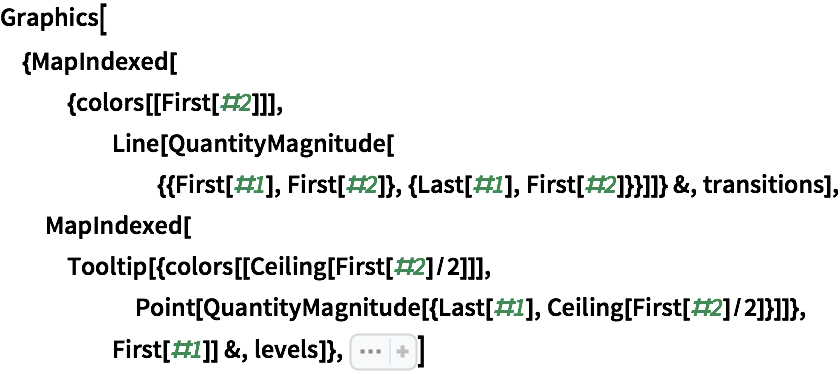
Plot each transition in terms of the energy levels of the initial and final atomic levels.
show complete Wolfram Language input
Out[11]=11