Wolfram視覺化Wolfram 語言
的核心部分

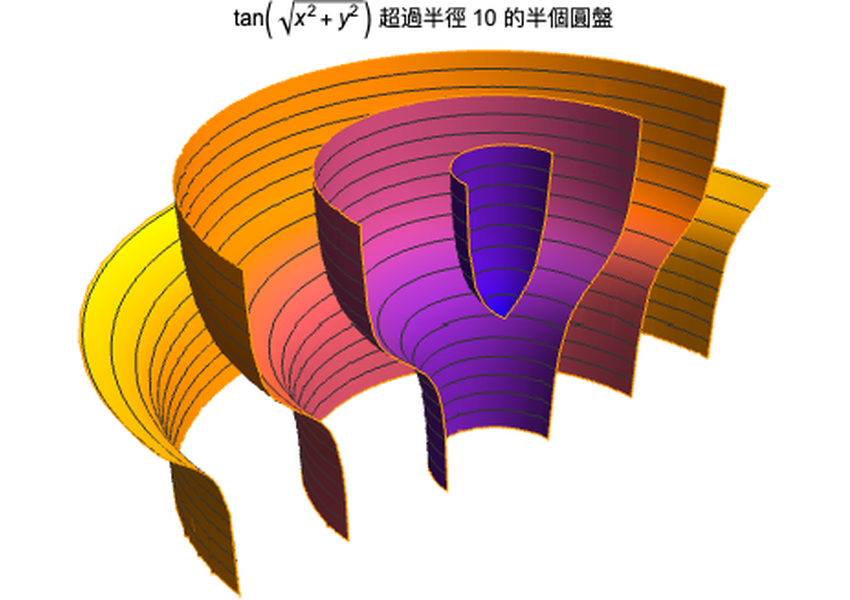
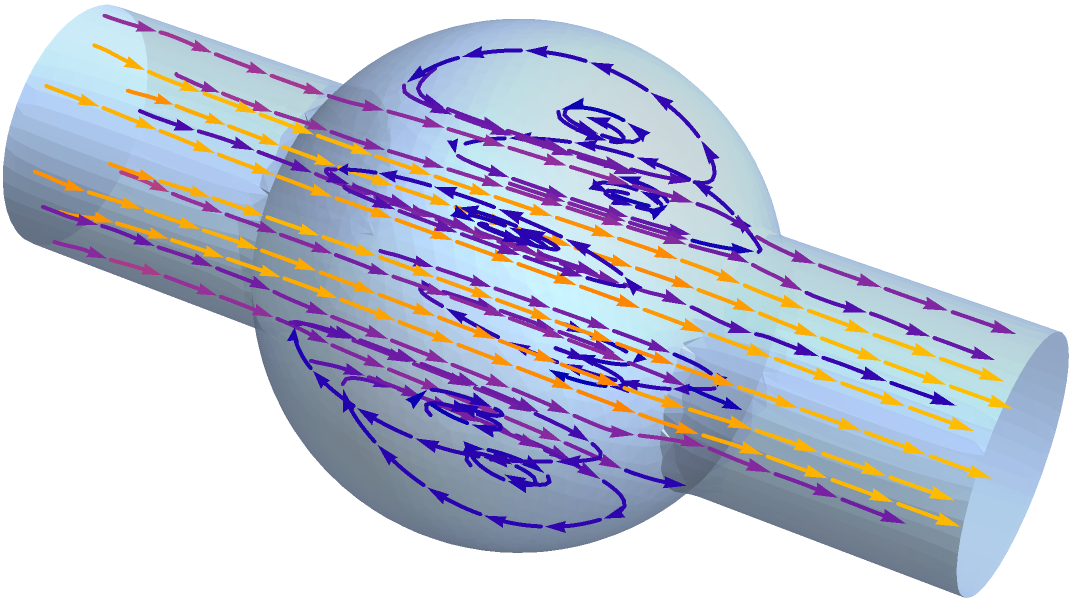
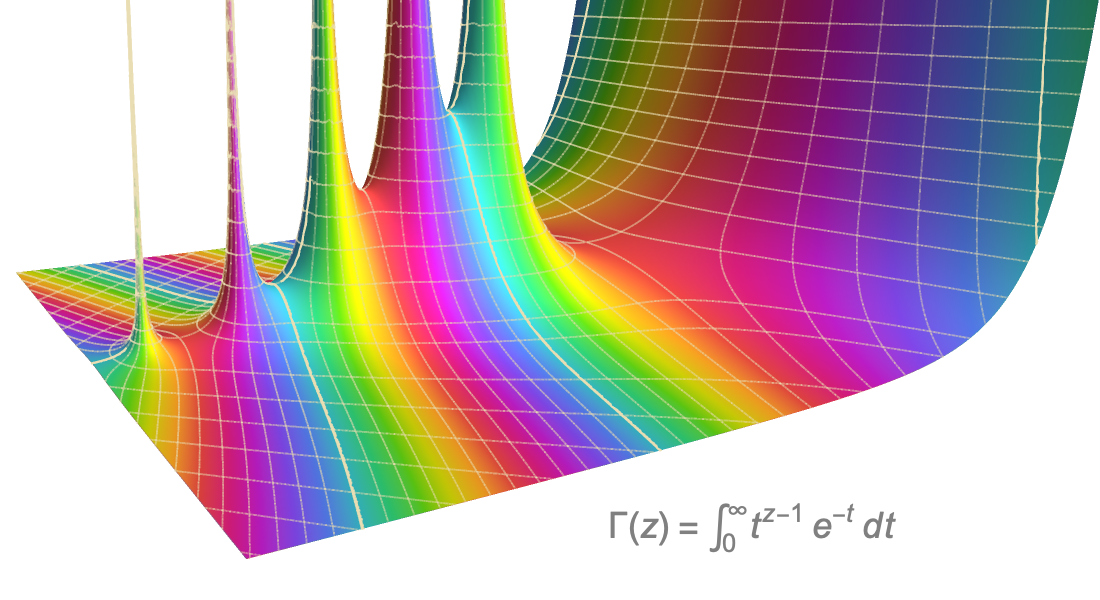
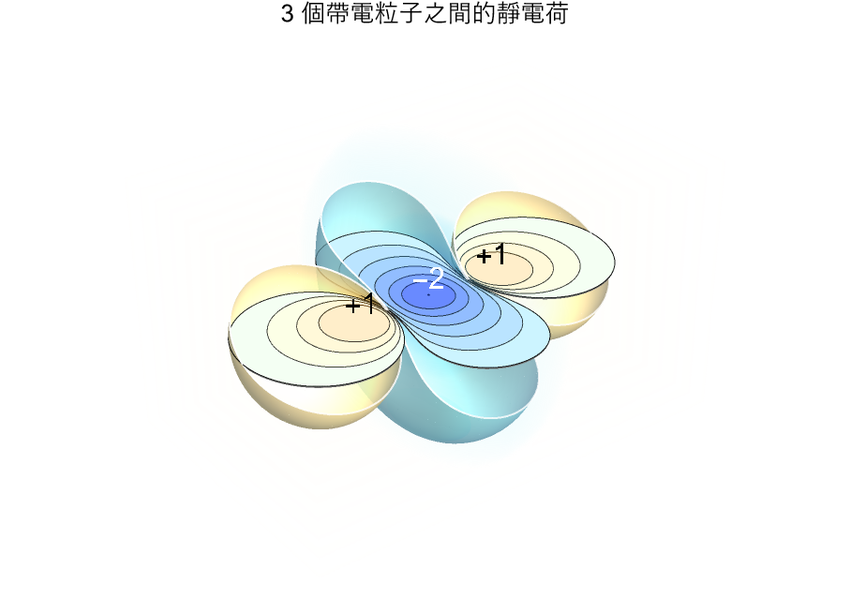
科學、資料和函數視覺化。
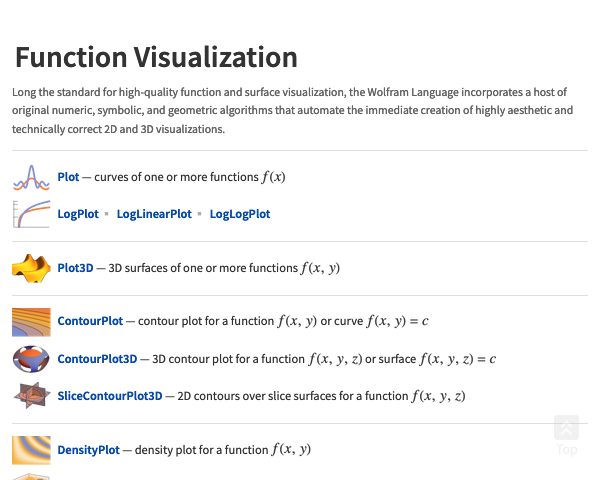
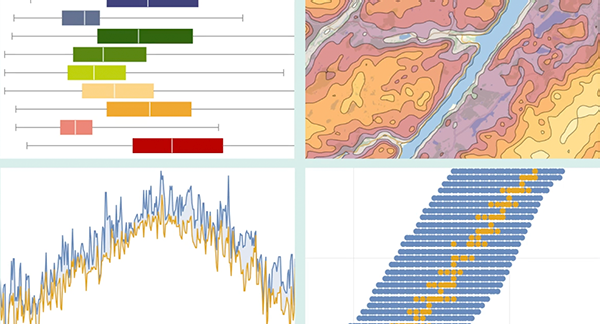
Wolfram 視覺化功能簡化並自動創建用在了解個人探索、報告和已發表論文的所有資料和函數的繪圖。
資料視覺化
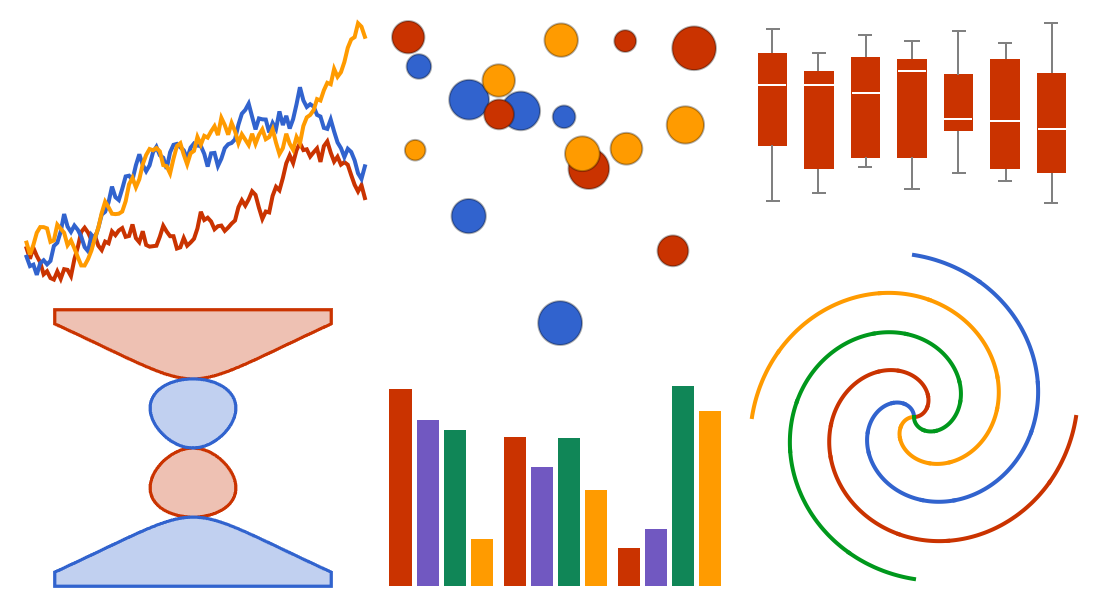
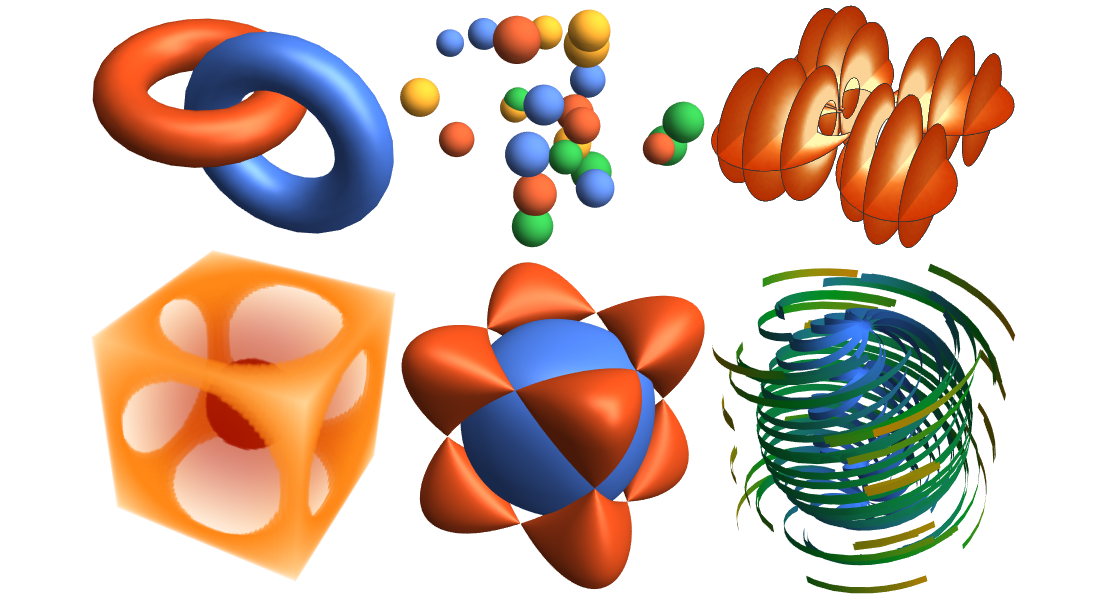
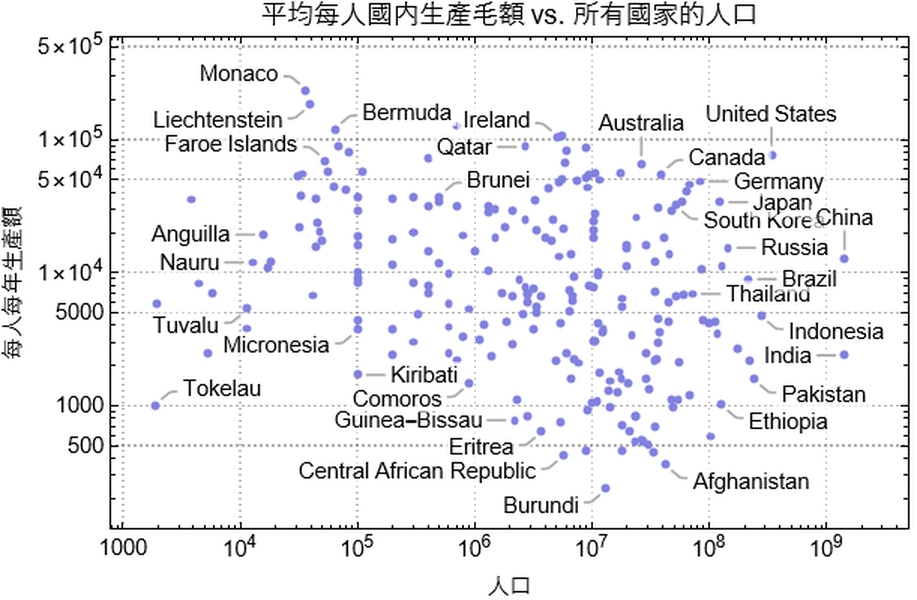
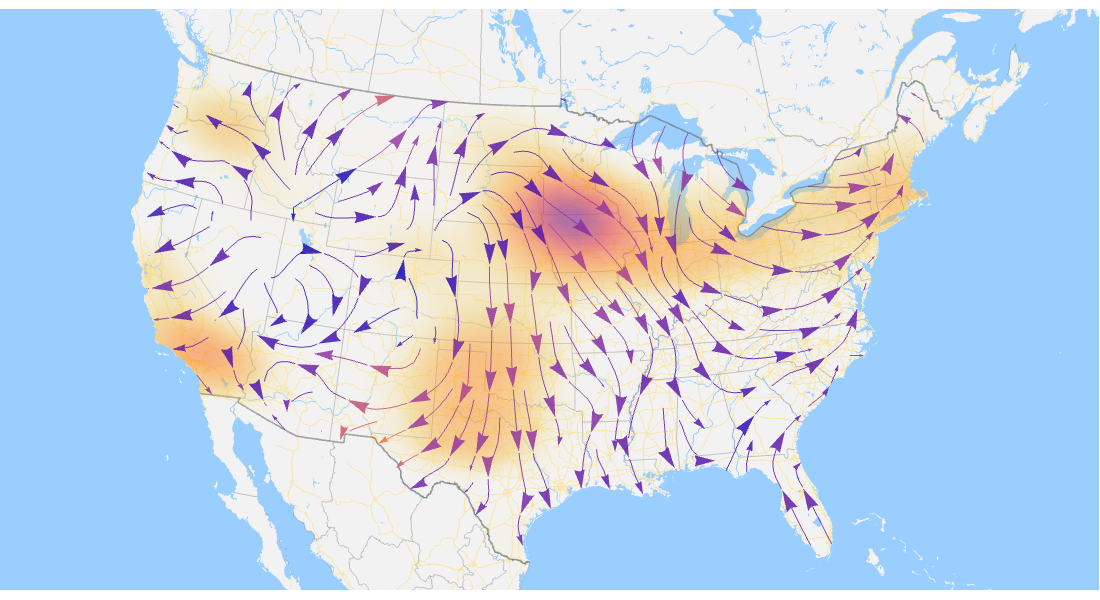
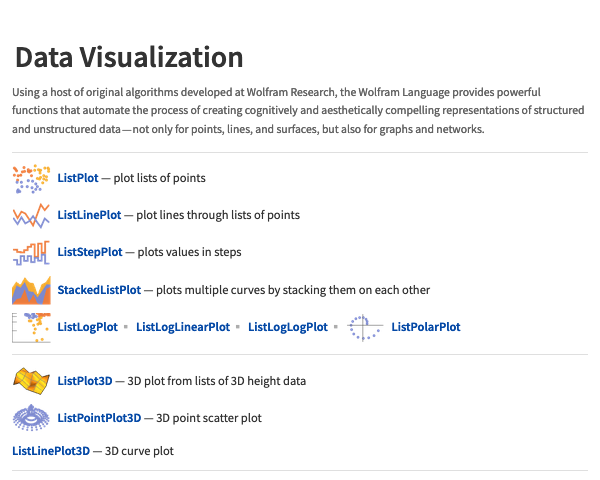
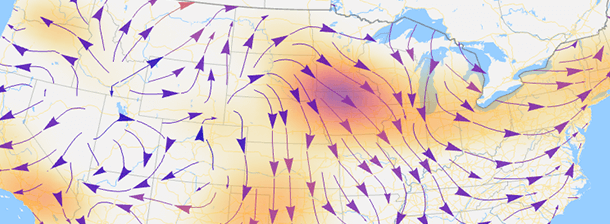
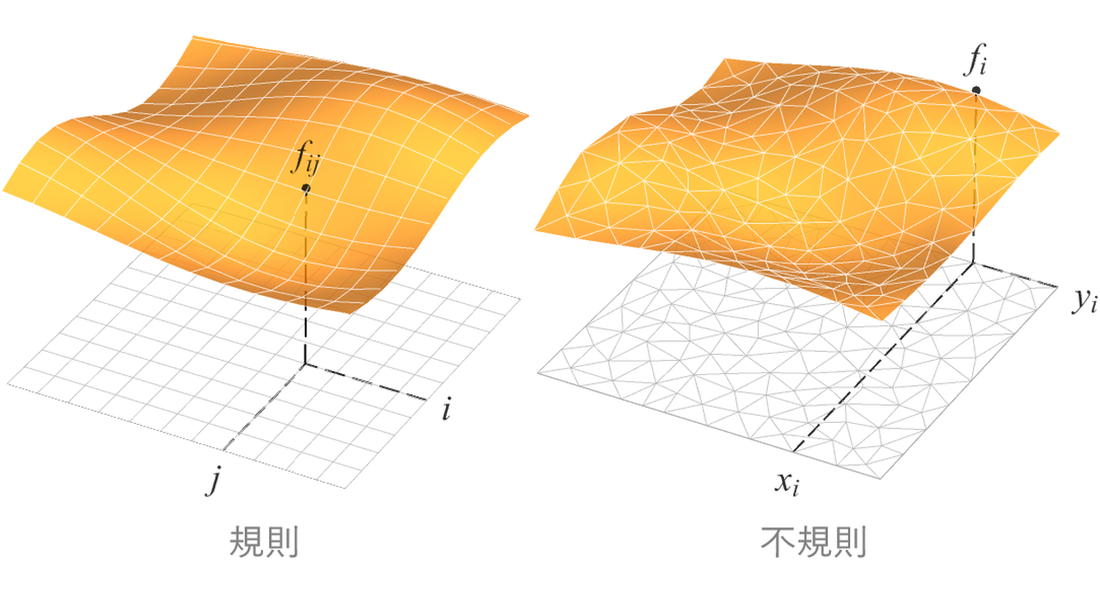
視覺化任何形式和維度的資料,從點到曲線和表面、體積、向量場等等。從試算表或不規則測量的數據點繪製資料。自動處理包含日期、單位、誤差槓或遺漏值的豐富資料。
創建客製視覺化
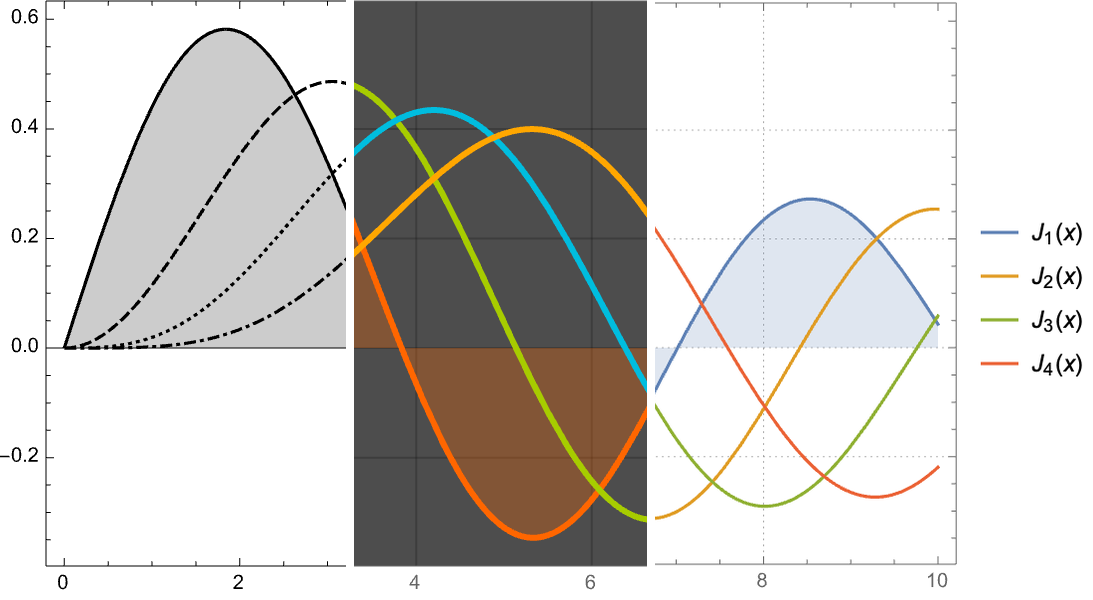
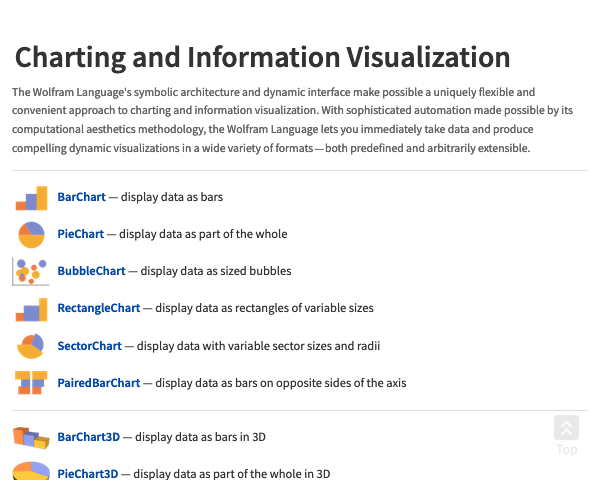
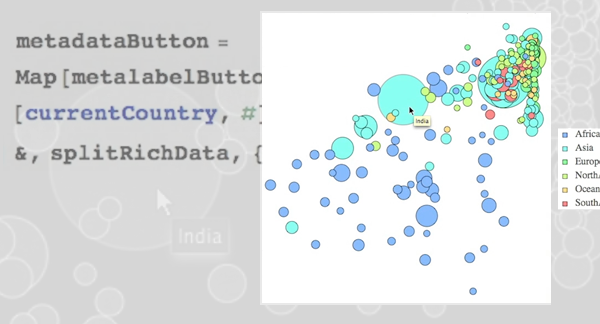
像專業人士一樣自定義圖示。通過調整顏色、樣式和視覺元素來修改原始圖示;與其他圖形元素相結合來實現豐富的視覺化;使用描述性基本圖形語言構建全新類型的視覺化。
閱讀、繪圖、分享
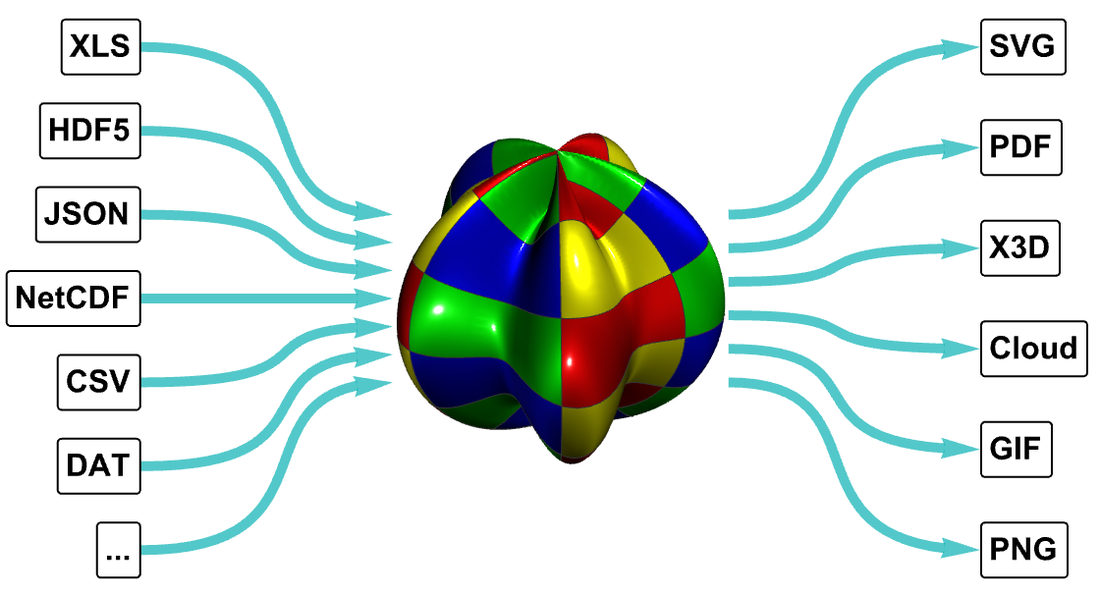
讀取各種文件格式的資料,包括 CSV、XLS、HDF5 等。使用正確的視覺化來説明資料。隨時隨地與任何人分享創作。推特動畫 GIF、以 PDF 格式發布清晰的向量圖形、在筆記本中部署實時圖形或 3D 列印繪圖。
Wolfram 視覺化文檔
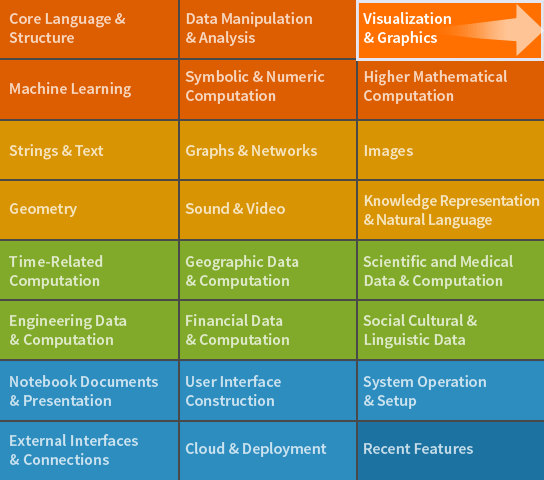
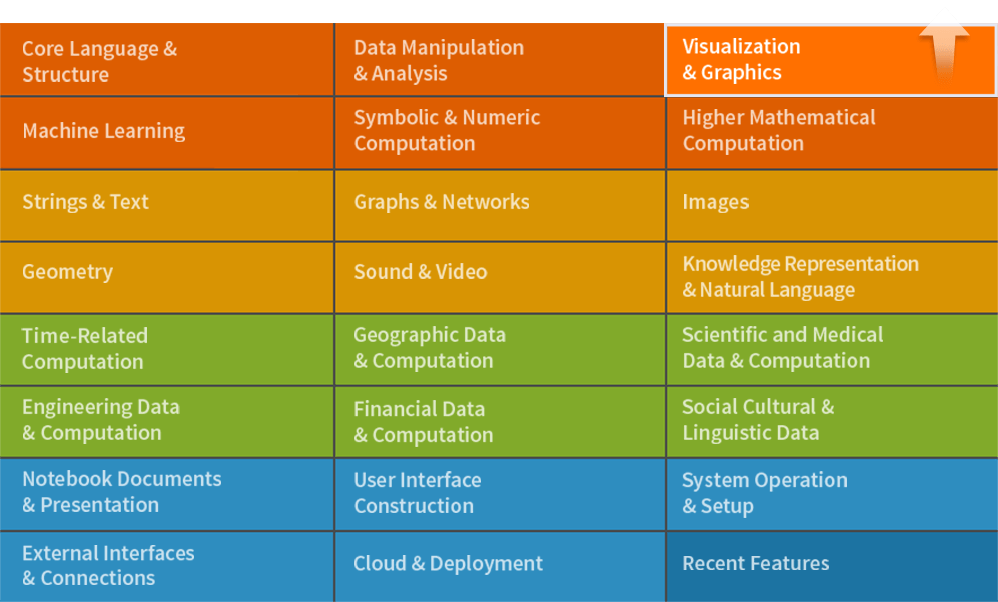
Wolfram 視覺化 是 Wolfram 語言 的部分匯集。完整的系統包含 6,000 多個內建函數,涵蓋所有計算領域 — 都經過精心整合,因此可以完美地將工作結合完成。
完整範圍和文件
RectangleChart ▪ SectorChart ▪ PairedBarChart ▪ PieChart3D ▪ BubbleChart3D ▪ RectangleChart3D ▪ SectorChart3D ▪ SmoothHistogram ▪ CandlestickChart ▪ InteractiveTradingChart ▪ RenkoChart ▪ GeoBubbleChart ▪ Manipulate ▪ Animate ▪ TabView ▪ ChartLabels ▪ ChartLegends ▪ Placed ▪ LabelingFunction ▪ LegendAppearance ▪ Style ▪ ChartStyle ▪ BarOrigin ▪ SectorOrigin ▪ BarSpacing ▪ SectorSpacing ▪ ChartElements ▪ ChartElementFunction ▪ PopupWindow ▪ Button ▪ Hyperlink ▪ IconData ▪ Plot ▪ LogPlot ▪ LogLinearPlot ▪ LogLogPlot ▪ Plot3D ▪ ContourPlot ▪ ContourPlot3D ▪ SliceContourPlot3D ▪ DensityPlot ▪ DensityPlot3D ▪ SliceDensityPlot3D ▪ ParametricPlot ▪ ParametricPlot3D ▪ PolarPlot ▪ RevolutionPlot3D ▪ SphericalPlot3D ▪ RegionPlot ▪ RegionPlot3D ▪ ComplexPlot ▪ ComplexPlot3D ▪ ReImPlot ▪ AbsArgPlot ▪ DiscretePlot3D ▪ VectorPlot ▪ StreamPlot ▪ VectorPlot3D ▪ StreamPlot3D ▪ SliceVectorPlot3D ▪ ListPlot ▪ ListLinePlot ▪ ListStepPlot ▪ StackedListPlot ▪ ListLogPlot ▪ ListLogLinearPlot ▪ ListLogLogPlot ▪ ListPolarPlot ▪ ListPlot3D ▪ ListPointPlot3D ▪ ListLinePlot3D ▪ ListDensityPlot ▪ ListDensityPlot3D ▪ ListContourPlot ▪ ListContourPlot3D ▪ ListSliceDensityPlot3D ▪ ListSliceContourPlot3D ▪ ListCurvePathPlot ▪ ListSurfacePlot3D ▪ ArrayPlot ▪ ReliefPlot ▪ MatrixPlot ▪ ArrayPlot3D ▪ TernaryListPlot ▪ DateListPlot ▪ DateListLogPlot ▪ TimelinePlot ▪ DateHistogram ▪ DateListStepPlot ▪ StackedDateListPlot ▪ ListVectorPlot ▪ ListStreamPlot ▪ ListVectorPlot3D ▪ ListStreamPlot3D ▪ ListSliceVectorPlot3D ▪ BarChart ▪ PieChart ▪ BubbleChart ▪ BarChart3D ▪ Histogram ▪ Histogram3D ▪ QuantilePlot ▪ BoxWhiskerChart ▪ AngularGauge ▪ HorizontalGauge ▪ VerticalGauge ▪ RadialAxisPlot ▪ PairwiseListPlot ▪ FeatureSpacePlot ▪ GraphPlot ▪ LayeredGraphPlot ▪ TreePlot ▪ Dendrogram ▪ ClusteringTree ▪ Grid ▪ Row ▪ Column ▪ Multicolumn ▪ GraphicsGrid ▪ GraphicsRow ▪ WordCloud ▪ ImageCollage ▪ ImageAssemble ▪ GeoListPlot ▪ GeoSmoothHistogram ▪ GeoRegionValuePlot ▪ NumberLinePlot ▪ DiscretePlot ▪ AnatomyPlot3D ▪ WaveletScalogram ▪ WaveletListPlot ▪ WaveletMatrixPlot ▪ ChromaticityPlot ▪ ChromaticityPlot3D ▪ Frame ▪ PlotStyle ▪ Filling ▪ Mesh ▪ ImageSize ▪ PlotLabels ▪ Labeled ▪ Callout ▪ PlotLegends ▪ Legended ▪ LineLegend ▪ BarLegend ▪ Tooltip ▪ StatusArea ▪ Inset ▪ Around ▪ IntervalMarkers ▪
