Dokumentation für Wolfram Visualisierung
Wolfram Visualisierung ist integrierter Bestandteil der Wolfram Language. Das vollständige System enthält über 6.000 eingebaute Funktionen, die alle Bereiche des Rechnens abdecken—alle sorgfältig integriert, damit sie perfekt zusammenarbeiten.
Vollständiger Umfang & Dokumentation
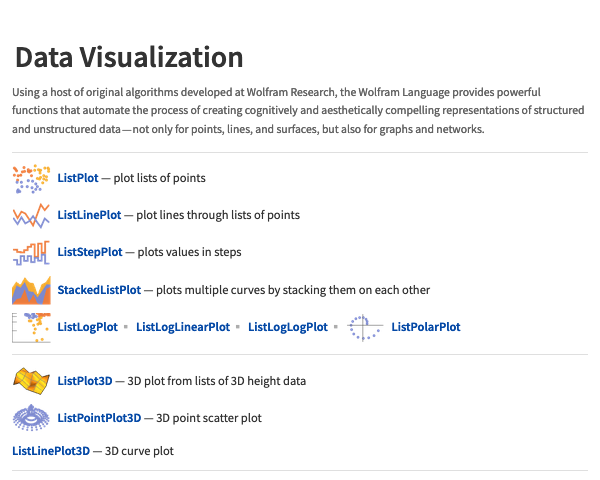
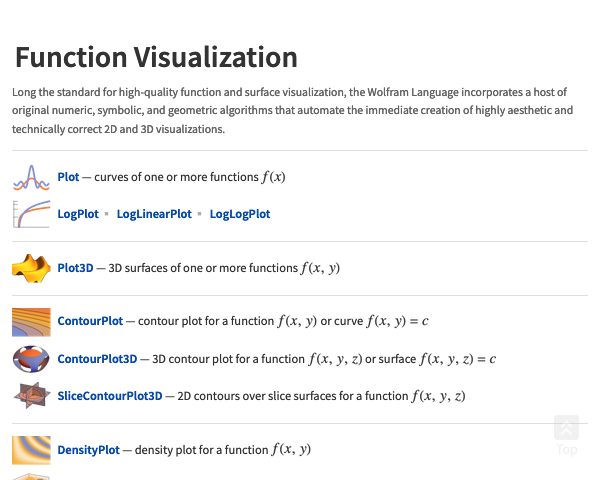
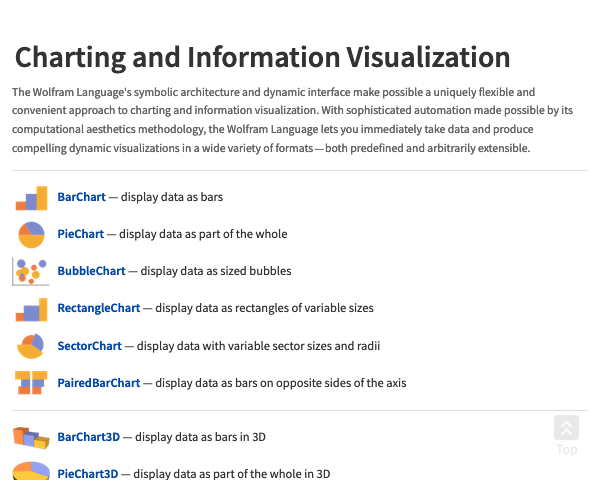
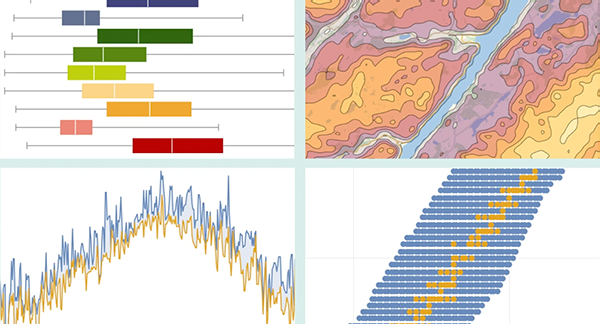
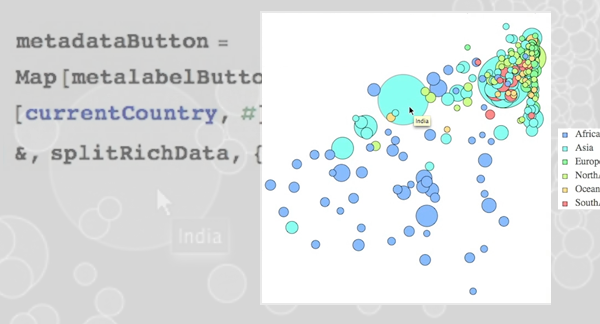
RectangleChart ▪ SectorChart ▪ PairedBarChart ▪ PieChart3D ▪ BubbleChart3D ▪ RectangleChart3D ▪ SectorChart3D ▪ SmoothHistogram ▪ CandlestickChart ▪ InteractiveTradingChart ▪ RenkoChart ▪ GeoBubbleChart ▪ Manipulate ▪ Animate ▪ TabView ▪ ChartLabels ▪ ChartLegends ▪ Placed ▪ LabelingFunction ▪ LegendAppearance ▪ Style ▪ ChartStyle ▪ BarOrigin ▪ SectorOrigin ▪ BarSpacing ▪ SectorSpacing ▪ ChartElements ▪ ChartElementFunction ▪ PopupWindow ▪ Button ▪ Hyperlink ▪ IconData ▪ Plot ▪ LogPlot ▪ LogLinearPlot ▪ LogLogPlot ▪ Plot3D ▪ ContourPlot ▪ ContourPlot3D ▪ SliceContourPlot3D ▪ DensityPlot ▪ DensityPlot3D ▪ SliceDensityPlot3D ▪ ParametricPlot ▪ ParametricPlot3D ▪ PolarPlot ▪ RevolutionPlot3D ▪ SphericalPlot3D ▪ RegionPlot ▪ RegionPlot3D ▪ ComplexPlot ▪ ComplexPlot3D ▪ ReImPlot ▪ AbsArgPlot ▪ DiscretePlot3D ▪ VectorPlot ▪ StreamPlot ▪ VectorPlot3D ▪ StreamPlot3D ▪ SliceVectorPlot3D ▪ ListPlot ▪ ListLinePlot ▪ ListStepPlot ▪ StackedListPlot ▪ ListLogPlot ▪ ListLogLinearPlot ▪ ListLogLogPlot ▪ ListPolarPlot ▪ ListPlot3D ▪ ListPointPlot3D ▪ ListLinePlot3D ▪ ListDensityPlot ▪ ListDensityPlot3D ▪ ListContourPlot ▪ ListContourPlot3D ▪ ListSliceDensityPlot3D ▪ ListSliceContourPlot3D ▪ ListCurvePathPlot ▪ ListSurfacePlot3D ▪ ArrayPlot ▪ ReliefPlot ▪ MatrixPlot ▪ ArrayPlot3D ▪ TernaryListPlot ▪ DateListPlot ▪ DateListLogPlot ▪ TimelinePlot ▪ DateHistogram ▪ DateListStepPlot ▪ StackedDateListPlot ▪ ListVectorPlot ▪ ListStreamPlot ▪ ListVectorPlot3D ▪ ListStreamPlot3D ▪ ListSliceVectorPlot3D ▪ BarChart ▪ PieChart ▪ BubbleChart ▪ BarChart3D ▪ Histogram ▪ Histogram3D ▪ QuantilePlot ▪ BoxWhiskerChart ▪ AngularGauge ▪ HorizontalGauge ▪ VerticalGauge ▪ RadialAxisPlot ▪ PairwiseListPlot ▪ FeatureSpacePlot ▪ GraphPlot ▪ LayeredGraphPlot ▪ TreePlot ▪ Dendrogram ▪ ClusteringTree ▪ Grid ▪ Row ▪ Column ▪ Multicolumn ▪ GraphicsGrid ▪ GraphicsRow ▪ WordCloud ▪ ImageCollage ▪ ImageAssemble ▪ GeoListPlot ▪ GeoSmoothHistogram ▪ GeoRegionValuePlot ▪ NumberLinePlot ▪ DiscretePlot ▪ AnatomyPlot3D ▪ WaveletScalogram ▪ WaveletListPlot ▪ WaveletMatrixPlot ▪ ChromaticityPlot ▪ ChromaticityPlot3D ▪ Frame ▪ PlotStyle ▪ Filling ▪ Mesh ▪ ImageSize ▪ PlotLabels ▪ Labeled ▪ Callout ▪ PlotLegends ▪ Legended ▪ LineLegend ▪ BarLegend ▪ Tooltip ▪ StatusArea ▪ Inset ▪ Around ▪ IntervalMarkers ▪