Documentación de Wolfram Visualización
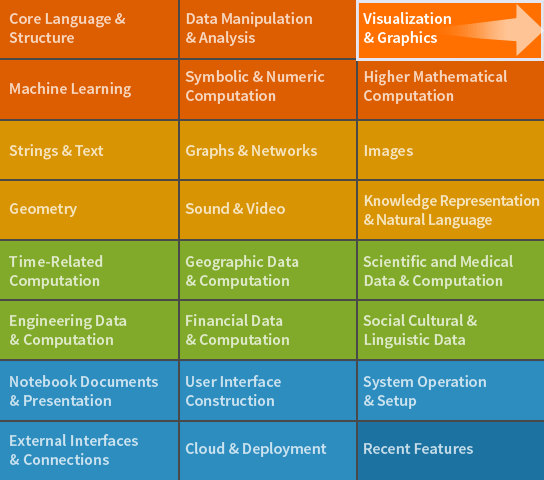
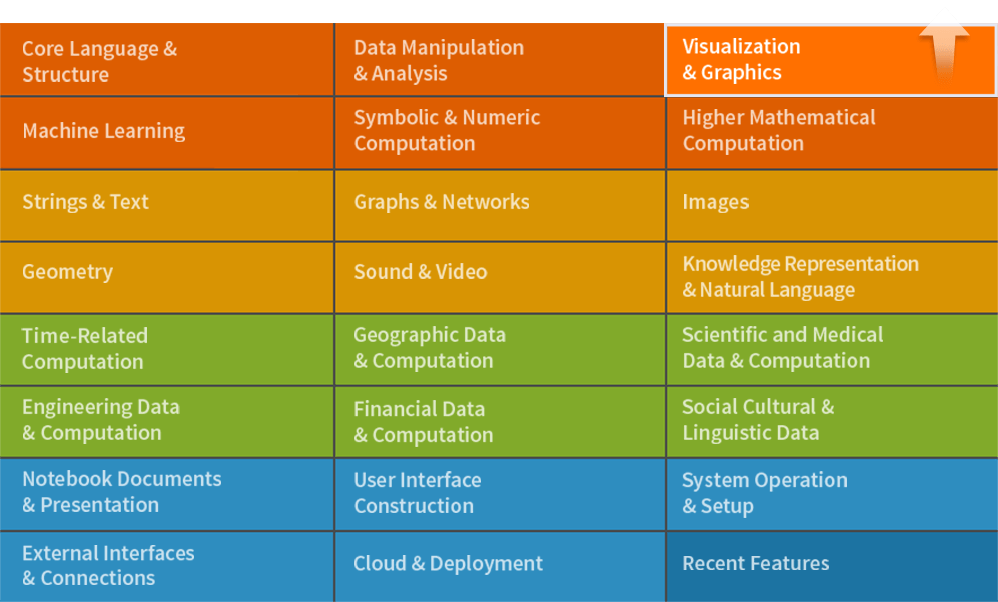
Wolfram Visualización es una parte integrada de Wolfram Language. El sistema completo contiene más de 6000 funciones incorporadas que abarcan todas las áreas de la computación, todas cuidadosamente integradas de manera que trabajen perfectamente en conjunto.
Wolfram Language
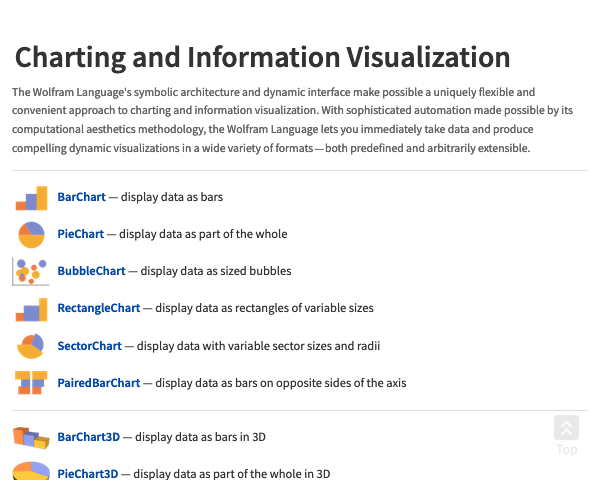
RectangleChart ▪ SectorChart ▪ PairedBarChart ▪ PieChart3D ▪ BubbleChart3D ▪ RectangleChart3D ▪ SectorChart3D ▪ SmoothHistogram ▪ CandlestickChart ▪ InteractiveTradingChart ▪ RenkoChart ▪ GeoBubbleChart ▪ Manipulate ▪ Animate ▪ TabView ▪ ChartLabels ▪ ChartLegends ▪ Placed ▪ LabelingFunction ▪ LegendAppearance ▪ Style ▪ ChartStyle ▪ BarOrigin ▪ SectorOrigin ▪ BarSpacing ▪ SectorSpacing ▪ ChartElements ▪ ChartElementFunction ▪ PopupWindow ▪ Button ▪ Hyperlink ▪ IconData ▪ Plot ▪ LogPlot ▪ LogLinearPlot ▪ LogLogPlot ▪ Plot3D ▪ ContourPlot ▪ ContourPlot3D ▪ SliceContourPlot3D ▪ DensityPlot ▪ DensityPlot3D ▪ SliceDensityPlot3D ▪ ParametricPlot ▪ ParametricPlot3D ▪ PolarPlot ▪ RevolutionPlot3D ▪ SphericalPlot3D ▪ RegionPlot ▪ RegionPlot3D ▪ ComplexPlot ▪ ComplexPlot3D ▪ ReImPlot ▪ AbsArgPlot ▪ DiscretePlot3D ▪ VectorPlot ▪ StreamPlot ▪ VectorPlot3D ▪ StreamPlot3D ▪ SliceVectorPlot3D ▪ ListPlot ▪ ListLinePlot ▪ ListStepPlot ▪ StackedListPlot ▪ ListLogPlot ▪ ListLogLinearPlot ▪ ListLogLogPlot ▪ ListPolarPlot ▪ ListPlot3D ▪ ListPointPlot3D ▪ ListLinePlot3D ▪ ListDensityPlot ▪ ListDensityPlot3D ▪ ListContourPlot ▪ ListContourPlot3D ▪ ListSliceDensityPlot3D ▪ ListSliceContourPlot3D ▪ ListCurvePathPlot ▪ ListSurfacePlot3D ▪ ArrayPlot ▪ ReliefPlot ▪ MatrixPlot ▪ ArrayPlot3D ▪ TernaryListPlot ▪ DateListPlot ▪ DateListLogPlot ▪ TimelinePlot ▪ DateHistogram ▪ DateListStepPlot ▪ StackedDateListPlot ▪ ListVectorPlot ▪ ListStreamPlot ▪ ListVectorPlot3D ▪ ListStreamPlot3D ▪ ListSliceVectorPlot3D ▪ BarChart ▪ PieChart ▪ BubbleChart ▪ BarChart3D ▪ Histogram ▪ Histogram3D ▪ QuantilePlot ▪ BoxWhiskerChart ▪ AngularGauge ▪ HorizontalGauge ▪ VerticalGauge ▪ RadialAxisPlot ▪ PairwiseListPlot ▪ FeatureSpacePlot ▪ GraphPlot ▪ LayeredGraphPlot ▪ TreePlot ▪ Dendrogram ▪ ClusteringTree ▪ Grid ▪ Row ▪ Column ▪ Multicolumn ▪ GraphicsGrid ▪ GraphicsRow ▪ WordCloud ▪ ImageCollage ▪ ImageAssemble ▪ GeoListPlot ▪ GeoSmoothHistogram ▪ GeoRegionValuePlot ▪ NumberLinePlot ▪ DiscretePlot ▪ AnatomyPlot3D ▪ WaveletScalogram ▪ WaveletListPlot ▪ WaveletMatrixPlot ▪ ChromaticityPlot ▪ ChromaticityPlot3D ▪ Frame ▪ PlotStyle ▪ Filling ▪ Mesh ▪ ImageSize ▪ PlotLabels ▪ Labeled ▪ Callout ▪ PlotLegends ▪ Legended ▪ LineLegend ▪ BarLegend ▪ Tooltip ▪ StatusArea ▪ Inset ▪ Around ▪ IntervalMarkers ▪
