New in Wolfram
Mathematica
8: Enhanced 2D and 3D Graphics
◄
previous
|
next
►
Graphics & Visualization
Various Text Effects Using Filled Curves
Extract outline curves from fonts and apply various effects.
In[1]:=
X
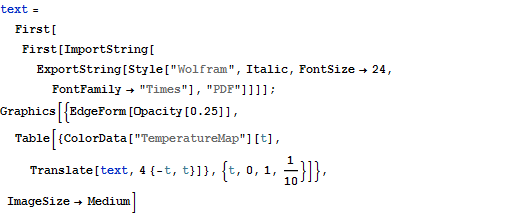
text = First[ First[ImportString[ ExportString[ Style["Wolfram", Italic, FontSize -> 24, FontFamily -> "Times"], "PDF"]]]]; Graphics[{EdgeForm[Opacity[0.25]], Table[{ColorData["TemperatureMap"][t], Translate[text, 4 {-t, t}]}, {t, 0, 1, 1/10}]}, ImageSize -> Medium]
Out[1]=
In[2]:=
X
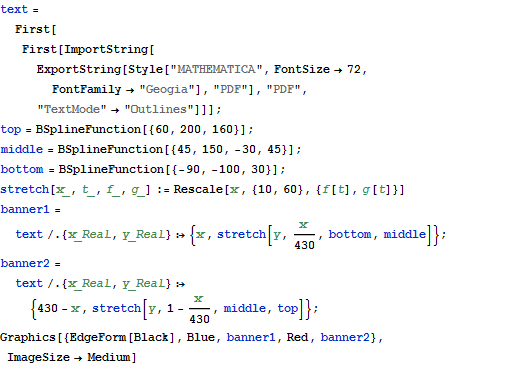
text = First[ First[ImportString[ ExportString[ Style["MATHEMATICA", FontSize -> 72, FontFamily -> "Geogia"], "PDF"], "PDF", "TextMode" -> "Outlines"]]]; top = BSplineFunction[{60, 200, 160}]; middle = BSplineFunction[{45, 150, -30, 45}]; bottom = BSplineFunction[{-90, -100, 30}]; stretch[x_, t_, f_, g_] := Rescale[x, {10, 60}, {f[t], g[t]}] banner1 = text /. {x_Real, y_Real} :> {x, stretch[y, x/430, bottom, middle]}; banner2 = text /. {x_Real, y_Real} :> {430 - x, stretch[y, 1 - x/430, middle, top]}; Graphics[{EdgeForm[Black], Blue, banner1, Red, banner2}, ImageSize -> Medium]
Out[2]=