Wolfram
Mathematica
8의 신기능: 금융 시각화
◄
이전
|
다음
►
그래픽 및 시각화
차트 요소 표시에 대한 사용자 정의
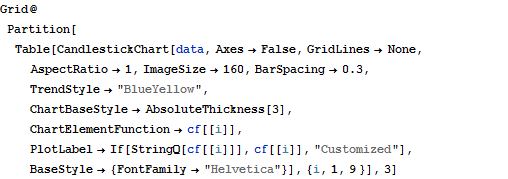
금융 차트 요소에 다양한 모양을 사용하여 표시합니다.
In[1]:=
X
data = FinancialData["MSFT", "OHLC", {{2010, 1, 8}, {2010, 1, 15}}];
In[2]:=
X
cross[{{xmin_, xmax_}, {ymin_, ymax_}}, {o_, h_, l_, c_}, metadata_] := {Line[{{(xmin + xmax)/2, l}, {(xmin + xmax)/2, h}}], Line[{{xmin, o}, {xmax, c}}]}
In[3]:=
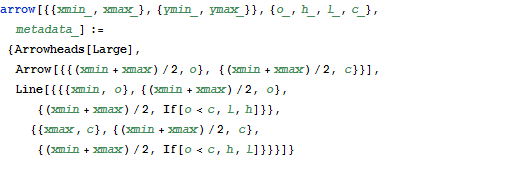
X
arrow[{{xmin_, xmax_}, {ymin_, ymax_}}, {o_, h_, l_, c_}, metadata_] := {Arrowheads[Large], Arrow[{{(xmin + xmax)/2, o}, {(xmin + xmax)/2, c}}], Line[{{{xmin, o}, {(xmin + xmax)/2, o}, {(xmin + xmax)/2, If[o < c, l, h]}}, {{xmax, c}, {(xmin + xmax)/2, c}, {(xmin + xmax)/2, If[o < c, h, l]}}}]}
In[4]:=
X
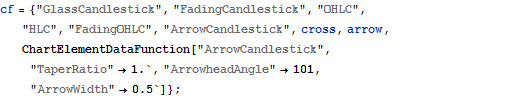
cf = {"GlassCandlestick", "FadingCandlestick", "OHLC", "HLC", "FadingOHLC", "ArrowCandlestick", cross, arrow, ChartElementDataFunction["ArrowCandlestick", "TaperRatio" -> 1., "ArrowheadAngle" -> 101, "ArrowWidth" -> 0.5]};
In[5]:=
X
Grid@Partition[ Table[CandlestickChart[data, Axes -> False, GridLines -> None, AspectRatio -> 1, ImageSize -> 160, BarSpacing -> 0.3, TrendStyle -> "BlueYellow", ChartBaseStyle -> AbsoluteThickness[3], ChartElementFunction -> cf[[i]], PlotLabel -> If[StringQ[cf[[i]]], cf[[i]], "Customized"], BaseStyle -> {FontFamily -> "Helvetica"}], {i, 1, 9 }], 3]
Out[5]=