New in Wolfram
Mathematica
8: Financial Visualization
◄
previous
|
next
►
Graphics & Visualization
Highlight Trends with Different Color Schemes
Use named or custom styles for up and down trends.
In[1]:=
X
data = FinancialData["MSFT", "OHLC", {{2010, 1, 8}, {2010, 1, 15}}];
In[2]:=
X
g1 = Table[ CandlestickChart[data, Axes -> False, GridLines -> None, AspectRatio -> 1, ImageSize -> 165, BarSpacing -> 0.3, ChartBaseStyle -> AbsoluteThickness[3], ChartElementFunction -> "FadingCandlestick", TrendStyle -> ts, PlotLabel -> ts, BaseStyle -> {FontFamily -> "Helvetica"}], {ts, {"RedGreen", "BlueYellow", "Gold"}}];
In[3]:=
X
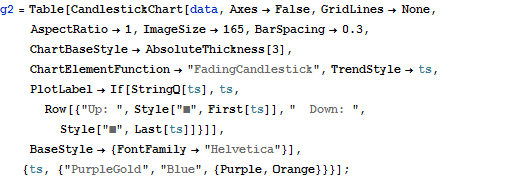
g2 = Table[ CandlestickChart[data, Axes -> False, GridLines -> None, AspectRatio -> 1, ImageSize -> 165, BarSpacing -> 0.3, ChartBaseStyle -> AbsoluteThickness[3], ChartElementFunction -> "FadingCandlestick", TrendStyle -> ts, PlotLabel -> If[StringQ[ts], ts, Row[{"Up: ", Style["\[FilledSquare]", First[ts]], " Down: ", Style["\[FilledSquare]", Last[ts]]}]], BaseStyle -> {FontFamily -> "Helvetica"}], {ts, {"PurpleGold", "Blue", {Purple, Orange}}}];
In[4]:=
X
g3 = Table[ CandlestickChart[data, Axes -> False, GridLines -> None, AspectRatio -> 1, ImageSize -> 165, BarSpacing -> 0.2, ChartBaseStyle -> AbsoluteThickness[3], ChartElementFunction -> "FadingCandlestick", TrendStyle -> ts, PlotLabel -> If[StringQ[ts], ts, Row[{"Up: ", Style["\[FilledSquare]", ts], " Down: ", "\[EmptySquare]"}]], BaseStyle -> {FontFamily -> "Helvetica"}], {ts, {"BlackSilver", "BrownYellow", Black}}];
In[5]:=
X
Grid[{g1, g2, g3}]
Out[5]=