New in Wolfram
Mathematica
8: Graph & Network Modeling
◄
previous
|
next
►
Application Areas
Construct Biochemical Networks
The glycogen degradation pathway topology.
In[1]:=
X
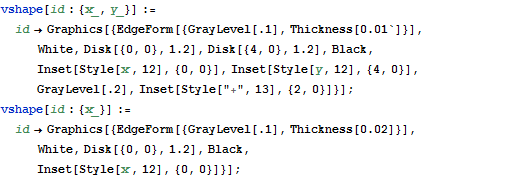
vshape[id : {x_, y_}] := id -> Graphics[{EdgeForm[{GrayLevel[.1], Thickness[0.01]}], White, Disk[{0, 0}, 1.2], Disk[{4, 0}, 1.2], Black, Inset[Style[x, 12], {0, 0}], Inset[Style[y, 12], {4, 0}], GrayLevel[.2], Inset[Style["+", 13], {2, 0}]}]; vshape[id : {x_}] := id -> Graphics[{EdgeForm[{GrayLevel[.1], Thickness[0.02]}], White, Disk[{0, 0}, 1.2], Black, Inset[Style[x, 12], {0, 0}]}];
In[2]:=
X
vsize[id : {x_, y_}] := id -> {.2, .08}; vsize[id_] := id -> .2;
In[3]:=
X
label[id : {x_, y_}, idnames_] := id -> Placed[{Style[x, FontFamily -> "Arial"], Style[y, FontFamily -> "Arial"]} /. idnames, {{Above, Before}, {Below, After}}]; label[id : {x_}, idnames_] := id -> Placed[ Style[x, FontFamily -> "Arial"] /. idnames, {Below, After}]
In[4]:=
X
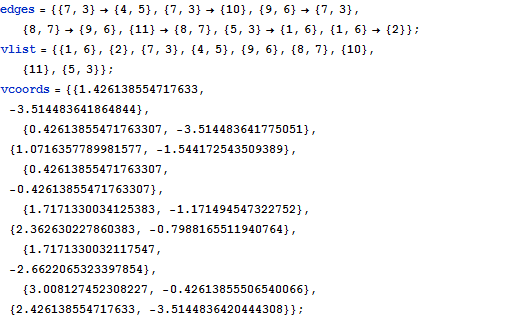
edges = {{7, 3} -> {4, 5}, {7, 3} -> {10}, {9, 6} -> {7, 3}, {8, 7} -> {9, 6}, {11} -> {8, 7}, {5, 3} -> {1, 6}, {1, 6} -> {2}}; vlist = {{1, 6}, {2}, {7, 3}, {4, 5}, {9, 6}, {8, 7}, {10}, {11}, {5, 3}}; vcoords = {{1.426138554717633, -3.514483641864844}, {0.42613855471763307, -3.514483641775051}, {1.0716357789981577, -1.544172543509389}, {0.42613855471763307, -0.42613855471763307}, {1.7171330034125383, \ -1.171494547322752}, {2.362630227860383, -0.7988165511940764}, {1.7171330032117547, -2.6622065323397854}, {3.008127452308227, \ -0.42613855506540066}, {2.426138554717633, -3.5144836420444308}};
In[5]:=
X
idnames = {1 -> "D-(+)-glucose", 2 -> "glucose-6-P", 3 -> "maltotriose", 4 -> "alpha-glucose", 5 -> "maltose", 6 -> "maltotetraose", 7 -> "cori ester", 8 -> "a limit dextrin", 9 -> "a debranched limit dextrin", 10 -> "glucose-6-phosphate", 11 -> "a glycogen"};
In[6]:=
X
style = {EdgeStyle -> Gray, VertexShape -> (vshape /@ vlist), VertexSize -> (vsize /@ vlist), VertexLabels -> (label[#, idnames] & /@ vlist), VertexCoordinates -> vcoords , ImageSize -> 490, ImagePadding -> {{90, 60}, {30, 30}}};
In[7]:=
X
Graph[vlist, edges, style]
Out[7]=