New in Wolfram
Mathematica
8: Graph & Network Modeling
◄
previous
|
next
►
Application Areas
Illustrate Transformations
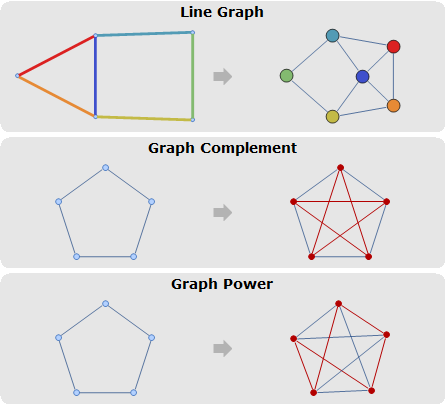
Highlight graph elements to illustrate operations in
Mathematica
8.
In[1]:=
X
color = ColorData[7, "ColorList"][[4 ;; 9]]; color = ColorData["Rainbow"] /@ (Range[6]/6);
In[2]:=
X
style = {VertexStyle -> Directive[Hue[.6, .3, 1], EdgeForm[Hue[.6, .8, .7]]], VertexSize -> Small, EdgeStyle -> Hue[.6, .8, .5], ImageSize -> {200, 100}};
In[3]:=
X
g = Graph[{1 \[UndirectedEdge] 2, 2 \[UndirectedEdge] 3, 3 \[UndirectedEdge] 4, 4 \[UndirectedEdge] 1, 5 \[UndirectedEdge] 1, 5 \[UndirectedEdge] 2}, style];
In[4]:=
X
name = {"Line Graph", "Graph Complement", "Graph Power"};
In[5]:=
X
info = {{HighlightGraph[g, MapThread[Style[#1, #2] &, {EdgeList[g], color}], EdgeStyle -> Directive[Thickness[0.015], Opacity[1]], VertexSize -> Tiny], \!\(\* GraphicsBox[ {Thickness[0.05263157894736842], FaceForm[{RGBColor[0.7, 0.7, 0.7], Opacity[1.]}], FilledCurveBox[{{{0, 2, 0}, {0, 1, 0}, {0, 1, 0}, {0, 1, 0}, { 0, 1, 0}, {0, 1, 0}}}, {{{9.9999, 18.}, {9.9999, 13.5}, {-0.00009999999999976694, 13.5}, {-0.00009999999999976694, 4.5}, {9.9999, 4.5}, { 9.9999, 0.}, {18.9999, 9.}}}]}, AspectRatio->Automatic, ImageSize->{19., 18.}, PlotRange->{{0., 19.}, {0., 18.}}]\), LineGraph[g, VertexStyle -> Thread[{1, 4, 3, 2, 6, 5} -> color], VertexSize -> 0.3, style]}, {g = CycleGraph[5, style], \!\(\* GraphicsBox[ {Thickness[0.05263157894736842], FaceForm[{RGBColor[0.7, 0.7, 0.7], Opacity[1.]}], FilledCurveBox[{{{0, 2, 0}, {0, 1, 0}, {0, 1, 0}, {0, 1, 0}, { 0, 1, 0}, {0, 1, 0}}}, {{{9.9999, 18.}, {9.9999, 13.5}, {-0.00009999999999976694, 13.5}, {-0.00009999999999976694, 4.5}, {9.9999, 4.5}, { 9.9999, 0.}, {18.9999, 9.}}}]}, AspectRatio->Automatic, ImageSize->{19., 18.}, PlotRange->{{0., 19.}, {0., 18.}}]\), HighlightGraph[CompleteGraph[5, style], GraphComplement[g]]}, {g = CycleGraph[5, style], \!\(\* GraphicsBox[ {Thickness[0.05263157894736842], FaceForm[{RGBColor[0.7, 0.7, 0.7], Opacity[1.]}], FilledCurveBox[{{{0, 2, 0}, {0, 1, 0}, {0, 1, 0}, {0, 1, 0}, { 0, 1, 0}, {0, 1, 0}}}, {{{9.9999, 18.}, {9.9999, 13.5}, {-0.00009999999999976694, 13.5}, {-0.00009999999999976694, 4.5}, {9.9999, 4.5}, { 9.9999, 0.}, {18.9999, 9.}}}]}, AspectRatio->Automatic, ImageSize->{19., 18.}, PlotRange->{{0., 19.}, {0., 18.}}]\), HighlightGraph[GraphPower[g, 2], g, style]}};
In[6]:=
X
ShowPlotSamples[name_, info_] := Framed[Column[{Style[name, 14, Bold, FontFamily -> "Verdana"], Grid[{info}]}, Alignment -> Center], RoundingRadius -> 9, FrameStyle -> None, Background -> GrayLevel@0.90];
In[7]:=
X
Column[MapThread[ShowPlotSamples, {name, info}]]
Out[7]=