New in Wolfram
Mathematica
8: New and Improved Scientific and Information Visualization
◄
previous
|
next
►
Graphics & Visualization
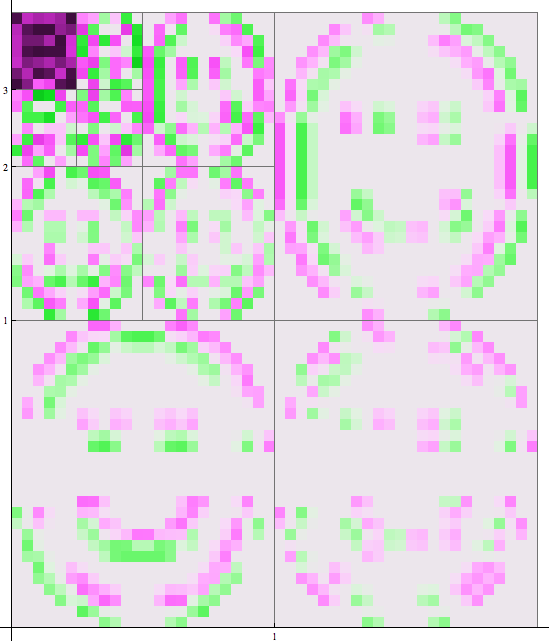
Create Matrix Plots of Discrete Wavelet Transforms
Create a matrix plot of the basis tree of the wavelet matrix coefficients for the discrete wavelet transform of a smiley face.
In[1]:=
X
WaveletMatrixPlot[DiscreteWaveletTransform[ImageData[\!\(\* GraphicsBox[ TagBox[RasterBox[CompressedData[" 1:eJztlU0KwjAQhafiwmt4AFeeQI9QT9CC3QpVkN7eiD9N5r2ZjAvBhQMpmbyv L+k0Iev+1A4LETmv0qPtrrtx7KbDMiX76XLs79I2tU1qjQ6ZAzSTrPGAOriS PZwpFv3JsL0+Yz7vU6KwFiMlDbIPgPVr1oF9UMI+m/kF4DcTYSlcvMgS2Ggs eVJQ8K/A1SRUjBf9h38O1psOkdy4CpdnrziMbKEmLAA3BqxpQR/c8KK6uQ2e lTlgjuL48NvKXioGn8SBeeIb16y16tGo2TRTdLF8F0pbFvrqJgMUp388gpso 4Fq8AbIODnA= "], {{0, 51}, {45, 0}}, {0, 1}, ColorFunction->GrayLevel], BoxForm`ImageTag["Bit", ColorSpace -> Automatic, Interleaving -> None], Selectable->False], BaseStyle->"ImageGraphics", ImageSizeRaw->{45, 51}, PlotRange->{{0, 45}, {0, 51}}]\)], Automatic, 3], ColorFunction -> "GreenPinkTones", ImageSize -> 550]
Out[1]=