New in Wolfram
Mathematica
8: Nonparametric, Derived, and Formula Distributions
◄
previous
|
next
►
Core Algorithms
Estimate Multivariate Nonparametric Probabilities and Expectations
The PDF of a bivariate density estimate, using
SmoothKernelDistribution
, shown with the data it was created from and the expected values of successive power sums.
In[1]:=
X
dist = MixtureDistribution[{2, .1}, {MultinormalDistribution[-1 {1, 1}, 2 IdentityMatrix[2]], MultinormalDistribution[2 {.5, .5}, .01 IdentityMatrix[2]]}]; BlockRandom[SeedRandom[15]; data = RandomVariate[dist, 250]];
In[2]:=
X
\[ScriptCapitalD] = SmoothKernelDistribution[data];
In[3]:=
X
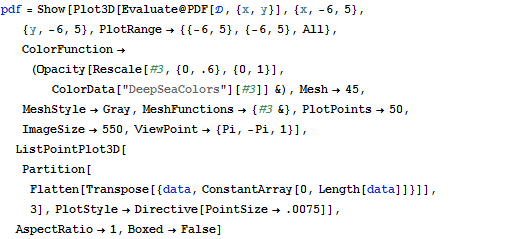
pdf = Show[ Plot3D[Evaluate@PDF[\[ScriptCapitalD], {x, y}], {x, -6, 5}, {y, -6, 5}, PlotRange -> {{-6, 5}, {-6, 5}, All}, ColorFunction -> (Opacity[Rescale[#3, {0, .6}, {0, 1}], ColorData["DeepSeaColors"][#3]] &), Mesh -> 45, MeshStyle -> Gray, MeshFunctions -> {#3 &}, PlotPoints -> 50, ImageSize -> 550, ViewPoint -> {Pi, -Pi, 1}], ListPointPlot3D[ Partition[ Flatten[Transpose[{data, ConstantArray[0, Length[data]]}]], 3], PlotStyle -> Directive[PointSize -> .0075]], AspectRatio -> 1, Boxed -> False]
Out[3]=
In[4]:=
X
\[ScriptCapitalD] = SmoothKernelDistribution[data];
In[5]:=
X
Table[Expectation[ x^i + y^i, {x, y} \[Distributed] \[ScriptCapitalD]], {i, 7}]
Out[5]=