New in Wolfram
Mathematica
8: Nonparametric, Derived, and Formula Distributions
◄
previous
|
next
►
Core Algorithms
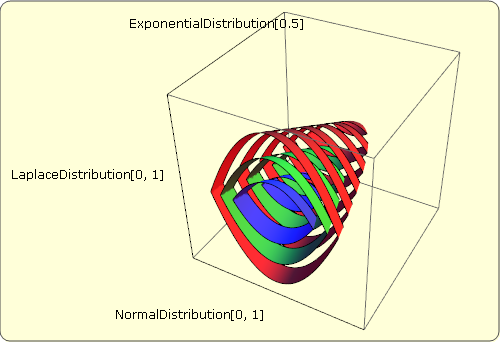
Visualize Iso-Probability Density Levels for a Product Distribution
Study the iso-probability density levels for a three-dimensional
ProductDistribution
.
In[1]:=
X
\[ScriptCapitalD] = ProductDistribution[NormalDistribution[], ExponentialDistribution[0.5], LaplaceDistribution[0, 1]];
In[2]:=
X
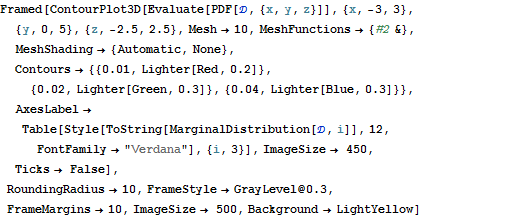
Framed[ContourPlot3D[ Evaluate[PDF[\[ScriptCapitalD], {x, y, z}]], {x, -3, 3}, {y, 0, 5}, {z, -2.5, 2.5}, Mesh -> 10, MeshFunctions -> {#2 &}, MeshShading -> {Automatic, None}, Contours -> {{0.01, Lighter[Red, 0.2]}, {0.02, Lighter[Green, 0.3]}, {0.04, Lighter[Blue, 0.3]}}, AxesLabel -> Table[Style[ToString[MarginalDistribution[\[ScriptCapitalD], i]], 12, FontFamily -> "Verdana"], {i, 3}], ImageSize -> 450, Ticks -> False], RoundingRadius -> 10, FrameStyle -> GrayLevel@0.3, FrameMargins -> 10, ImageSize -> 500, Background -> LightYellow]
Out[2]=