« View all new features in
Mathematica
9
◄
previous
|
next
►
New in
Mathematica
9
›
Built-in Integration with R
Hierarchical Clustering
Load
RLink
.
In[1]:=
X
Needs["RLink`"] InstallR[]
Start with some matrix data.
In[2]:=
X
mdata = RandomVariate[NormalDistribution[], {10, 5}]
Out[2]=
Send the data to R.
In[3]:=
X
RSet["y", mdata]
Out[3]=
Add labels to columns and rows.
In[4]:=
X
REvaluate[" { dimnames(y)<- list(paste(\"g\", 1:10, sep=\"\"), paste(\"t\", 1:5, \ sep=\"\")) y }"]
Out[4]=
Construct correlation and distance matrices.
In[5]:=
X
REvaluate[" { c <- cor(t(y), method=\"spearman\") d <- as.dist(1-c) }"]
Out[5]=
Call the hierarchical clustering routine.
In[6]:=
X
REvaluate["hr <- hclust(d, method = \"complete\", members=NULL)"]
Out[6]=
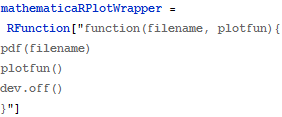
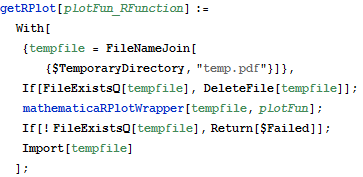
Define plotting functions from the example on higher-order functions.
In[7]:=
X
mathematicaRPlotWrapper = RFunction["function(filename, plotfun){ pdf(filename) plotfun() dev.off() }"]
Out[7]=
In[8]:=
X
getRPlot[plotFun_RFunction] := With[{tempfile = FileNameJoin[{$TemporaryDirectory, "temp.pdf"}]}, If[FileExistsQ[tempfile], DeleteFile[tempfile]]; mathematicaRPlotWrapper[tempfile, plotFun]; If[! FileExistsQ[tempfile], Return[$Failed]]; Import[tempfile] ];
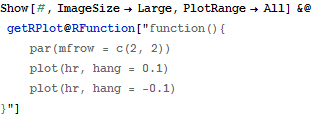
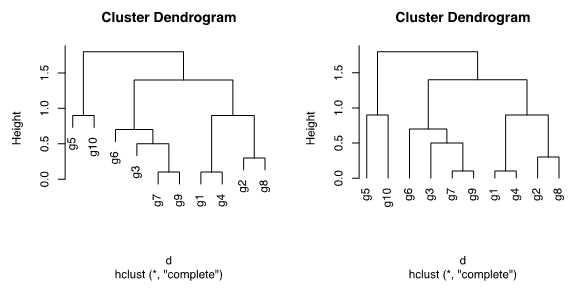
Produce the dendrogram plots (the "hang" parameter controls the way the dendrogram is plotted).
In[9]:=
X
Show[#, ImageSize -> Large, PlotRange -> All] &@ getRPlot@RFunction["function(){ par(mfrow = c(2, 2)) plot(hr, hang = 0.1) plot(hr, hang = -0.1) }"]
Out[9]=