« View all new features in
Mathematica
9
◄
previous
|
next
►
New in
Mathematica
9
›
Enhanced Graphs and Networks
Transportation Problems
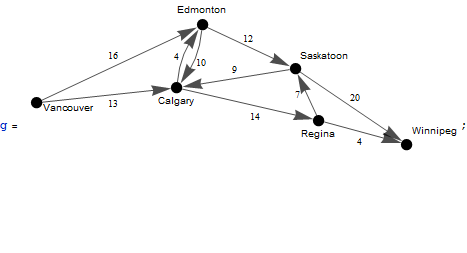
A railroad network serving six major Canadian cities, with the daily number of car compartments.
In[4]:=
X
Text[Grid[{#, \[ScriptCapitalF][#]} & /@ \[ScriptCapitalF][ "EdgeList"], Background -> {None, {{White, Lighter[Blend[{Blue, Green}], .8]}}}, Dividers -> All, Alignment -> {{Center, Right}}, ItemSize -> {{17, 6}}, Frame -> Darker[Gray, .6], ItemStyle -> 14, Spacings -> {Automatic, .8}]]
In[1]:=
X
g = \!\(\* GraphicsBox[ NamespaceBox["NetworkGraphics", DynamicModuleBox[{Typeset`graph = HoldComplete[ Graph[{"Vancouver", "Calgary", "Edmonton", "Regina", "Saskatoon", "Winnipeg"}, {{{1, 2}, {1, 3}, {2, 3}, {3, 2}, {2, 4}, {3, 5}, {5, 2}, {4, 5}, {4, 6}, {5, 6}}, Null}, { EdgeCapacity -> {13, 16, 4, 10, 14, 12, 9, 7, 4, 20}, EdgeLabels -> { DirectedEdge["Saskatoon", "Calgary"] -> Placed[ 9, {0.5, {0.5, 0}}], DirectedEdge["Edmonton", "Saskatoon"] -> Placed[ 12, {0.5, {0.5, 0}}], DirectedEdge["Edmonton", "Calgary"] -> Placed[ 10, {0.5, {-0.2, 1}}], DirectedEdge["Vancouver", "Edmonton"] -> Placed[ 16, {0.5, {1, 0}}], DirectedEdge["Saskatoon", "Winnipeg"] -> Placed[ 20, {0.5, {0, 0}}], DirectedEdge["Calgary", "Regina"] -> Placed[ 14, {0.6, {1, 1.5}}], DirectedEdge["Calgary", "Edmonton"] -> Placed[ 4, {0.3, {1, 0}}], DirectedEdge["Regina", "Saskatoon"] -> Placed[ 7, {0.3, {3, 0}}], DirectedEdge["Regina", "Winnipeg"] -> Placed[ 4, {0.5, {1, 1.5}}], DirectedEdge["Vancouver", "Calgary"] -> Placed[ 13, {0.6, {1, 1.5}}]}, GraphStyle -> "BasicBlack", ImagePadding -> {{0, 40}, {0, 10}}, VertexCoordinates -> {{-0.253, 0.112}, {-0.1419, 0.1239}, {-0.122, 0.1735}, {-0.02976, 0.0981}, {-0.0486, 0.139}, {0.03968, 0.07923}}, VertexLabels -> { "Winnipeg" -> Placed[ "Winnipeg", Automatic, Style[#, FontFamily -> "Helvetica"]& ], "Edmonton" -> Placed[ "Edmonton", Above, Style[#, FontFamily -> "Helvetica"]& ], "Vancouver" -> Placed[ "Vancouver", {{1.5, -1}, {0, 0}}, Style[#, FontFamily -> "Helvetica"]& ], "Saskatoon" -> Placed[ "Saskatoon", Automatic, Style[#, FontFamily -> "Helvetica"]& ], "Calgary" -> Placed[ "Calgary", Below, Style[#, FontFamily -> "Helvetica"]& ], "Regina" -> Placed[ "Regina", Below, Style[#, FontFamily -> "Helvetica"]& ]}, VertexSize -> {Medium}}]], Typeset`boxes, Typeset`boxes$s2d = GraphicsGroupBox[{{ Arrowheads[0.05043608380268435], { TagBox[ StyleBox[ ArrowBox[{ DynamicLocation["VertexID$1", Automatic, Center], DynamicLocation["VertexID$2", Automatic, Center]}], Directive[ GrayLevel[0], Opacity[0.7]], StripOnInput -> False], "DynamicName", BoxID -> "EdgeLabelID$1"], InsetBox[ FormBox["13", TraditionalForm], Offset[{0, 2}, DynamicLocation["EdgeLabelID$1", Automatic, Scaled[0.6]]], ImageScaled[{1, 1.5}], BaseStyle -> "Graphics"]}, { TagBox[ StyleBox[ ArrowBox[{ DynamicLocation["VertexID$1", Automatic, Center], DynamicLocation["VertexID$3", Automatic, Center]}], Directive[ GrayLevel[0], Opacity[0.7]], StripOnInput -> False], "DynamicName", BoxID -> "EdgeLabelID$2"], InsetBox[ FormBox["16", TraditionalForm], Offset[{0, 2}, DynamicLocation["EdgeLabelID$2", Automatic, Scaled[0.5]]], ImageScaled[{1, 0}], BaseStyle -> "Graphics"]}, { TagBox[ StyleBox[ ArrowBox[ BezierCurveBox[{ DynamicLocation[ "VertexID$2", Automatic, Center], {-0.1396519231276212, 0.15179008609354164`}, DynamicLocation["VertexID$3", Automatic, Center]}]], Directive[ GrayLevel[0], Opacity[0.7]], StripOnInput -> False], "DynamicName", BoxID -> "EdgeLabelID$3"], InsetBox[ FormBox["4", TraditionalForm], Offset[{0, 2}, DynamicLocation["EdgeLabelID$3", Automatic, Scaled[0.3]]], ImageScaled[{1, 0}], BaseStyle -> "Graphics"]}, { TagBox[ StyleBox[ ArrowBox[{ DynamicLocation["VertexID$2", Automatic, Center], DynamicLocation["VertexID$4", Automatic, Center]}], Directive[ GrayLevel[0], Opacity[0.7]], StripOnInput -> False], "DynamicName", BoxID -> "EdgeLabelID$4"], InsetBox[ FormBox["14", TraditionalForm], Offset[{0, 2}, DynamicLocation["EdgeLabelID$4", Automatic, Scaled[0.6]]], ImageScaled[{1, 1.5}], BaseStyle -> "Graphics"]}, { TagBox[ StyleBox[ ArrowBox[ BezierCurveBox[{ DynamicLocation[ "VertexID$3", Automatic, Center], {-0.12424807687237878`, 0.14560991390645844`}, DynamicLocation["VertexID$2", Automatic, Center]}]], Directive[ GrayLevel[0], Opacity[0.7]], StripOnInput -> False], "DynamicName", BoxID -> "EdgeLabelID$5"], InsetBox[ FormBox["10", TraditionalForm], Offset[{0, 2}, DynamicLocation["EdgeLabelID$5", Automatic, Scaled[0.5]]], ImageScaled[{-0.2, 1}], BaseStyle -> "Graphics"]}, { TagBox[ StyleBox[ ArrowBox[{ DynamicLocation["VertexID$3", Automatic, Center], DynamicLocation["VertexID$5", Automatic, Center]}], Directive[ GrayLevel[0], Opacity[0.7]], StripOnInput -> False], "DynamicName", BoxID -> "EdgeLabelID$6"], InsetBox[ FormBox["12", TraditionalForm], Offset[{0, 2}, DynamicLocation["EdgeLabelID$6", Automatic, Scaled[0.5]]], ImageScaled[{0.5, 0}], BaseStyle -> "Graphics"]}, { TagBox[ StyleBox[ ArrowBox[{ DynamicLocation["VertexID$4", Automatic, Center], DynamicLocation["VertexID$5", Automatic, Center]}], Directive[ GrayLevel[0], Opacity[0.7]], StripOnInput -> False], "DynamicName", BoxID -> "EdgeLabelID$7"], InsetBox[ FormBox["7", TraditionalForm], Offset[{0, 2}, DynamicLocation["EdgeLabelID$7", Automatic, Scaled[0.3]]], ImageScaled[{3, 0}], BaseStyle -> "Graphics"]}, { TagBox[ StyleBox[ ArrowBox[{ DynamicLocation["VertexID$4", Automatic, Center], DynamicLocation["VertexID$6", Automatic, Center]}], Directive[ GrayLevel[0], Opacity[0.7]], StripOnInput -> False], "DynamicName", BoxID -> "EdgeLabelID$8"], InsetBox[ FormBox["4", TraditionalForm], Offset[{0, 2}, DynamicLocation["EdgeLabelID$8", Automatic, Scaled[0.5]]], ImageScaled[{1, 1.5}], BaseStyle -> "Graphics"]}, { TagBox[ StyleBox[ ArrowBox[{ DynamicLocation["VertexID$5", Automatic, Center], DynamicLocation["VertexID$2", Automatic, Center]}], Directive[ GrayLevel[0], Opacity[0.7]], StripOnInput -> False], "DynamicName", BoxID -> "EdgeLabelID$9"], InsetBox[ FormBox["9", TraditionalForm], Offset[{0, 2}, DynamicLocation["EdgeLabelID$9", Automatic, Scaled[0.5]]], ImageScaled[{0.5, 0}], BaseStyle -> "Graphics"]}, { TagBox[ StyleBox[ ArrowBox[{ DynamicLocation["VertexID$5", Automatic, Center], DynamicLocation["VertexID$6", Automatic, Center]}], Directive[ GrayLevel[0], Opacity[0.7]], StripOnInput -> False], "DynamicName", BoxID -> "EdgeLabelID$10"], InsetBox[ FormBox["20", TraditionalForm], Offset[{0, 2}, DynamicLocation["EdgeLabelID$10", Automatic, Scaled[0.5]]], ImageScaled[{0, 0}], BaseStyle -> "Graphics"]}}, { TagBox[{ TagBox[ StyleBox[ DiskBox[{-0.253, 0.112}, 0.004503060736876642], GrayLevel[0], StripOnInput -> False], "DynamicName", BoxID -> "VertexID$1"], InsetBox[ FormBox[ StyleBox["\"Vancouver\"", FontFamily -> "Helvetica", StripOnInput -> False], TraditionalForm], Dynamic[DynamicLocation[ "VertexID$1", Automatic, {Left, Bottom}] + ( DynamicLocation[ "VertexID$1", Automatic, { Right, Top}] - DynamicLocation[ "VertexID$1", Automatic, {Left, Bottom}]) {1.5, -1}], ImageScaled[{0, 0}], BaseStyle -> "Graphics"]}, "DynamicName", BoxID -> "VertexLabelID$1"], TagBox[{ TagBox[ StyleBox[ DiskBox[{-0.1419, 0.1239}, 0.004503060736876642], GrayLevel[0], StripOnInput -> False], "DynamicName", BoxID -> "VertexID$2"], InsetBox[ FormBox[ StyleBox["\"Calgary\"", FontFamily -> "Helvetica", StripOnInput -> False], TraditionalForm], Offset[{0, -2}, DynamicLocation["VertexID$2", Automatic, Bottom]], ImageScaled[{0.5, 1}], BaseStyle -> "Graphics"]}, "DynamicName", BoxID -> "VertexLabelID$2"], TagBox[{ TagBox[ StyleBox[ DiskBox[{-0.122, 0.1735}, 0.004503060736876642], GrayLevel[0], StripOnInput -> False], "DynamicName", BoxID -> "VertexID$3"], InsetBox[ FormBox[ StyleBox["\"Edmonton\"", FontFamily -> "Helvetica", StripOnInput -> False], TraditionalForm], Offset[{0, 2}, DynamicLocation["VertexID$3", Automatic, Top]], ImageScaled[{0.5, 0}], BaseStyle -> "Graphics"]}, "DynamicName", BoxID -> "VertexLabelID$3"], TagBox[{ TagBox[ StyleBox[ DiskBox[{-0.02976, 0.0981}, 0.004503060736876642], GrayLevel[0], StripOnInput -> False], "DynamicName", BoxID -> "VertexID$4"], InsetBox[ FormBox[ StyleBox["\"Regina\"", FontFamily -> "Helvetica", StripOnInput -> False], TraditionalForm], Offset[{0, -2}, DynamicLocation["VertexID$4", Automatic, Bottom]], ImageScaled[{0.5, 1}], BaseStyle -> "Graphics"]}, "DynamicName", BoxID -> "VertexLabelID$4"], TagBox[{ TagBox[ StyleBox[ DiskBox[{-0.0486, 0.139}, 0.004503060736876642], GrayLevel[0], StripOnInput -> False], "DynamicName", BoxID -> "VertexID$5"], InsetBox[ FormBox[ StyleBox["\"Saskatoon\"", FontFamily -> "Helvetica", StripOnInput -> False], TraditionalForm], Offset[{2, 2}, DynamicLocation["VertexID$5", Automatic, {Right, Top}]], ImageScaled[{0, 0}], BaseStyle -> "Graphics"]}, "DynamicName", BoxID -> "VertexLabelID$5"], TagBox[{ TagBox[ StyleBox[ DiskBox[{0.03968, 0.07923}, 0.004503060736876642], GrayLevel[0], StripOnInput -> False], "DynamicName", BoxID -> "VertexID$6"], InsetBox[ FormBox[ StyleBox["\"Winnipeg\"", FontFamily -> "Helvetica", StripOnInput -> False], TraditionalForm], Offset[{2, 2}, DynamicLocation["VertexID$6", Automatic, {Right, Top}]], ImageScaled[{0, 0}], BaseStyle -> "Graphics"]}, "DynamicName", BoxID -> "VertexLabelID$6"]}}], $CellContext`flag}, TagBox[ DynamicBox[GraphComputation`NetworkGraphicsBox[ 3, Typeset`graph, Typeset`boxes, $CellContext`flag], { CachedValue :> Typeset`boxes, SingleEvaluation -> True, SynchronousUpdating -> False, TrackedSymbols :> {$CellContext`flag}}, ImageSizeCache->{{7.959999999999937, 435.3696168708662}, {-125.3584, 20.43893432856855}}], MouseAppearanceTag["NetworkGraphics"]], AllowKernelInitialization->False, UnsavedVariables:>{$CellContext`flag}]], DefaultBaseStyle->{ "NetworkGraphics", FrontEnd`GraphicsHighlightColor -> Hue[0.8, 1., 0.6]}, FrameTicks->None, ImagePadding->{{0, 40}, {0, 10}}, ImageSize->{438., Automatic}]\);
Find the maximum number of compartments that can be carried from Vancouver to Winnipeg.
In[2]:=
X
\[ScriptCapitalF] = FindMaximumFlow[g, "Vancouver", "Winnipeg", "OptimumFlowData"];
In[3]:=
X
\[ScriptCapitalF]["FlowValue"]
Out[3]=
Number of compartments between cities.
Out[4]=
Show the flows of compartments.
In[5]:=
X
Panel[Show[{CountryData["Canada", "Shape"], \[ScriptCapitalF][ "FlowGraph"]}, PlotRange -> {{-0.31, 0.083}, {0.04, 0.25}}]]
Out[5]=