« View all new features in
Mathematica
9
◄
previous
|
next
►
New in
Mathematica
9
›
Gauges
Gauge Needles and Other Markers
In[1]:=
X
needles = Table[AngularGauge[RandomInteger[{1, 100}], {0, 100}, GaugeMarkers -> m, GaugeStyle -> RandomChoice[ColorData[67, "ColorList"]]], {m, ChartElementData["AngularGauge", "Markers"][[{2, 3, 6, 16, 18, 20}]]}];
In[2]:=
X
markers = Table[AngularGauge[42, {0, 100}, GaugeMarkers -> Placed["PolarMarker", p], GaugeFrameSize -> 0.2, GaugeStyle -> RandomChoice[ColorData[82, "ColorList"]]], {p, {"InsideScale", "OutsideScale", "Frame"}}];
In[3]:=
X
fills = MapThread[ AngularGauge[42, {0, 100}, GaugeMarkers -> Placed[#1, #2], GaugeStyle -> RandomChoice[ColorData[82, "ColorList"]]] &, {ChartElementData[ "AngularGauge", "Markers"][[{9, 15, 9}]], {"DivisionCenter", "DivisionInterval", "ScaleRange"}}];
In[4]:=
X
Grid[Partition[Join[needles, markers, fills], 3]]
In[5]:=
X
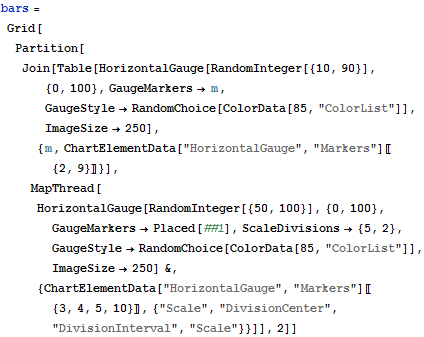
bars = Grid[ Partition[ Join[Table[ HorizontalGauge[RandomInteger[{10, 90}], {0, 100}, GaugeMarkers -> m, GaugeStyle -> RandomChoice[ColorData[85, "ColorList"]], ImageSize -> 250], {m, ChartElementData["HorizontalGauge", "Markers"][[{2, 9}]]}], MapThread[ HorizontalGauge[RandomInteger[{50, 100}], {0, 100}, GaugeMarkers -> Placed[##1], ScaleDivisions -> {5, 2}, GaugeStyle -> RandomChoice[ColorData[85, "ColorList"]], ImageSize -> 250] &, {ChartElementData["HorizontalGauge", "Markers"][[{3, 4, 5, 10}]], {"Scale", "DivisionCenter", "DivisionInterval", "Scale"}}]], 2]]
Specify the needle appearance for a gauge, position a marker along the scale, or fill in the scale to the appropriate value.
Out[4]=
Out[5]=