« View all new features in
Mathematica
9
◄
previous
|
next
►
New in
Mathematica
9
›
Legends
Combine a Legended Plot with Other Plots
In[1]:=
X
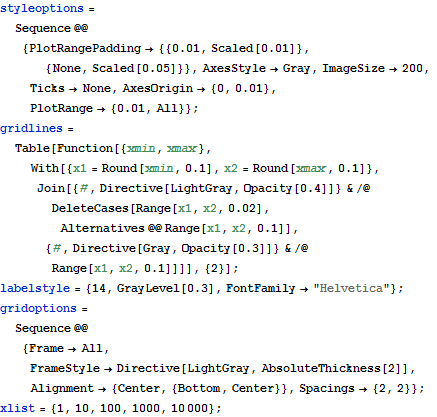
styleoptions = Sequence @@ {PlotRangePadding -> {{0.01, Scaled[0.01]}, {None, Scaled[0.05]}}, AxesStyle -> Gray, ImageSize -> 200, Ticks -> None, AxesOrigin -> {0, 0.01}, PlotRange -> {0.01, All}}; gridlines = Table[Function[{xmin, xmax}, With[{x1 = Round[xmin, 0.1], x2 = Round[xmax, 0.1]}, Join[{#, Directive[LightGray, Opacity[0.4]]} & /@ DeleteCases[Range[x1, x2, 0.02], Alternatives @@ Range[x1, x2, 0.1]], {#, Directive[Gray, Opacity[0.3]]} & /@ Range[x1, x2, 0.1]]]], {2}]; labelstyle = {14, GrayLevel[0.3], FontFamily -> "Helvetica"}; gridoptions = Sequence @@ {Frame -> All, FrameStyle -> Directive[LightGray, AbsoluteThickness[2]], Alignment -> {Center, {Bottom, Center}}, Spacings -> {2, 2}}; xlist = {1, 10, 100, 1000, 10000};
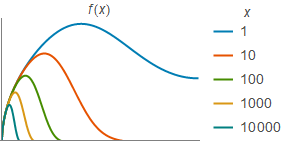
Plot a function with various parameter values with a legend.
In[2]:=
X
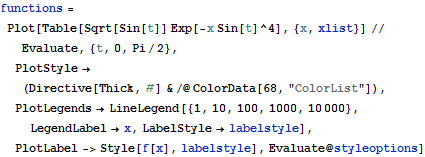
functions = Plot[Table[Sqrt[Sin[t]] Exp[-x Sin[t]^4], {x, xlist}] // Evaluate, {t, 0, Pi/2}, PlotStyle -> (Directive[Thick, #] & /@ ColorData[68, "ColorList"]), PlotLegends -> LineLegend[{1, 10, 100, 1000, 10000}, LegendLabel -> x, LabelStyle -> labelstyle], PlotLabel -> Style[f[x], labelstyle], Evaluate@styleoptions]
Out[2]=
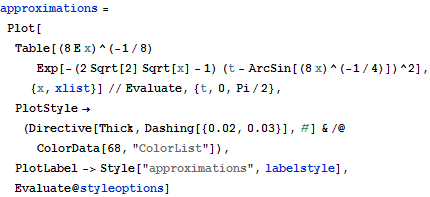
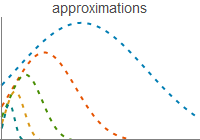
Plot approximations of the function for the same parameter values.
In[3]:=
X
approximations = Plot[Table[(8 E x)^(-1/ 8) Exp[-(2 Sqrt[2] Sqrt[x] - 1) (t - ArcSin[(8 x)^(-1/4)])^2], {x, xlist}] // Evaluate, {t, 0, Pi/2}, PlotStyle -> (Directive[Thick, Dashing[{0.02, 0.03}], #] & /@ ColorData[68, "ColorList"]), PlotLabel -> Style["approximations", labelstyle], Evaluate@styleoptions]
Out[3]=
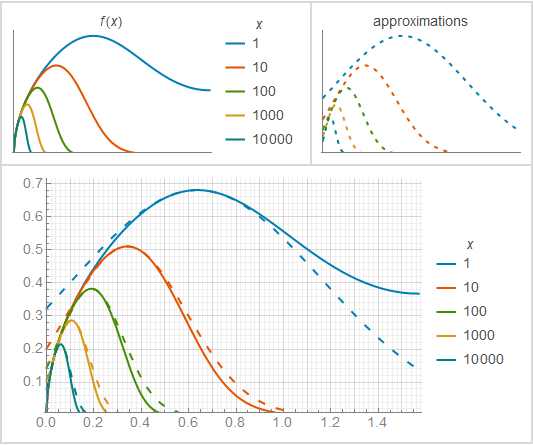
Combine the plots, including the legend, and add some additional options.
In[4]:=
X
Grid[{{functions, approximations}, {Show[functions, approximations, ImageSize -> 400, GridLines -> gridlines, LabelStyle -> labelstyle, PlotLabel -> None, Ticks -> Automatic], SpanFromLeft}}, Evaluate@gridoptions]
Out[4]=