« View all new features in
Mathematica
9
◄
previous
|
next
►
New in
Mathematica
9
›
Legends
Legend-Specific Values
In[1]:=
X
styles = Sequence @@ {ImageSize -> 400, ChartStyle -> Gray, GridLinesStyle -> Directive[AbsoluteThickness[3], LightGray]};
In[2]:=
X
data = {0.3, 0.3, 1.2, 0.8, 3.1, 1, 4, 0.1};
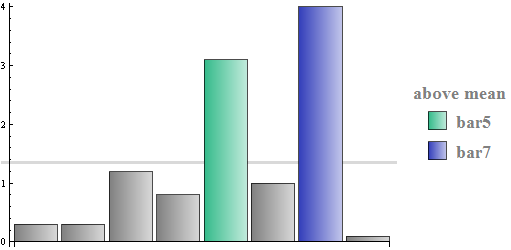
Modify the data to add a unique color and legend text for elements in the data that are larger than the mean.
In[3]:=
X
newdata = MapIndexed[If[# > Mean[data], Style[ Legended[#, Row[{"bar", First[#2]}]], ColorData[63, First[#2]]], #] &, data];
Create a bar chart that legends the elements that are larger than the mean.
In[4]:=
X
BarChart[newdata, ChartElementFunction -> "FadingRectangle", GridLines -> {None, {Mean[data]}}, Evaluate@styles, ChartLegends -> SwatchLegend[None, LegendMarkerSize -> 20, LegendMarkers -> "FadingRectangle", LabelStyle -> {Gray, Bold, 18}, LegendLabel -> "above mean"]]
Out[4]=