« View all new features in
Mathematica
9
◄
previous
|
next
►
New in
Mathematica
9
›
Social Network Analysis
Statistical Analysis of the Slashdot Social Network
Use
Mathematica'
s strong probability and statistical capabilities to analyze the social network emerging from Slashdot, a technology-related news website known for its specific user community.
In[1]:=
X
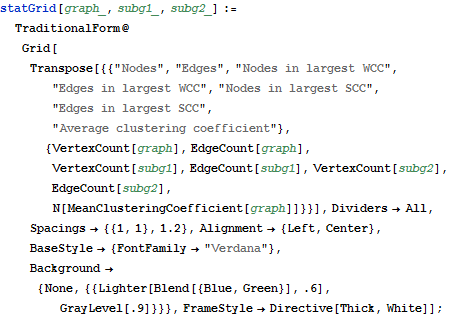
statGrid[graph_, subg1_, subg2_] := TraditionalForm@ Grid[Transpose[{{"Nodes", "Edges", "Nodes in largest WCC", "Edges in largest WCC", "Nodes in largest SCC", "Edges in largest SCC", "Average clustering coefficient"}, {VertexCount[graph], EdgeCount[graph], VertexCount[subg1], EdgeCount[subg1], VertexCount[subg2], EdgeCount[subg2], N[MeanClusteringCoefficient[graph]]}}], Dividers -> All, Spacings -> {{1, 1}, 1.2}, Alignment -> {Left, Center}, BaseStyle -> {FontFamily -> "Verdana"}, Background -> {None, {{Lighter[Blend[{Blue, Green}], .6], GrayLevel[.9]}}}, FrameStyle -> Directive[Thick, White]];
In[2]:=
X
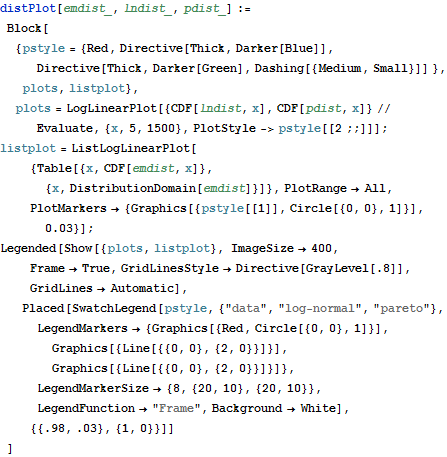
distPlot[emdist_, lndist_, pdist_] := Block[{pstyle = {Red, Directive[Thick, Darker[Blue]], Directive[Thick, Darker[Green], Dashing[{Medium, Small}]] }, plots, listplot}, plots = LogLinearPlot[{CDF[lndist, x], CDF[pdist, x]} // Evaluate, {x, 5, 1500}, PlotStyle -> pstyle[[2 ;;]]]; listplot = ListLogLinearPlot[{Table[{x, CDF[emdist, x]}, {x, DistributionDomain[emdist]}]}, PlotRange -> All, PlotMarkers -> {Graphics[{pstyle[[1]], Circle[{0, 0}, 1]}], 0.03}]; Legended[ Show[{plots, listplot}, ImageSize -> 400, Frame -> True, GridLinesStyle -> Directive[GrayLevel[.8]], GridLines -> Automatic], Placed[SwatchLegend[pstyle, {"data", "log-normal", "pareto"}, LegendMarkers -> {Graphics[{Red, Circle[{0, 0}, 1]}], Graphics[{Line[{{0, 0}, {2, 0}}]}], Graphics[{Line[{{0, 0}, {2, 0}}]}]}, LegendMarkerSize -> {8, {20, 10}, {20, 10}}, LegendFunction -> "Frame", Background -> White], {{.98, .03}, {1, 0}}]] ]
Import the data and build the friend/foe network.
In[3]:=
X
data = Import["http://snap.stanford.edu/data/soc-Slashdot0902.txt.gz", "Table"];
In[4]:=
X
graph = Graph[DirectedEdge @@@ data[[5 ;;]]];
Find the basic statistics.
In[5]:=
X
g = Subgraph[graph, First[WeaklyConnectedComponents[graph]]]; h = Subgraph[graph, Last[SortBy[ConnectedComponents[graph], Length]]]; statGrid[graph, g, h]
Out[5]//TraditionalForm=
Analyze the in-degree distribution.
In[6]:=
X
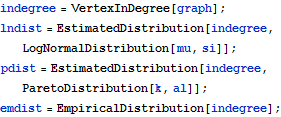
indegree = VertexInDegree[graph]; lndist = EstimatedDistribution[indegree, LogNormalDistribution[mu, si]]; pdist = EstimatedDistribution[indegree, ParetoDistribution[k, al]]; emdist = EmpiricalDistribution[indegree];
In[7]:=
X
distPlot[emdist, lndist, pdist]
Out[7]=