New in Wolfram Mathematica 7: Automated Charting Graphics  previous | next 
Make Non-Conventional Uses of Charts
Make use of flexible options of charts to achieve surprising applications.
In[1]:=

Click for copyable input
data = ColorData["Atoms", "Panel"][[1, 1, 1, 

    2]] /. {{color_, 

      EventHandler[{Rectangle[__], 

        Inset[Style[

          element_, __], __]}, {"MouseClicked" :> (SelectionMove[

           ButtonNotebook[], After, ButtonCell]; 

          NotebookWrite[ButtonNotebook[], ToBoxes[_]])}]} :> 

     Labeled[Style[ElementData[element, "AtomicWeight"], color], 

      element, Above], {} -> None};
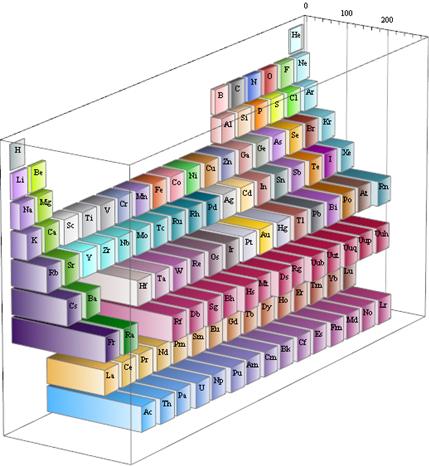
In[2]:=

Click for copyable input
BarChart3D[Transpose@Reverse@data, ChartLayout -> "Grid", 

 BoxRatios -> {5, 18, 10}, Method -> {"Canvas" -> None}, 

 Boxed -> True, Ticks -> {Automatic, None, None}, BarOrigin -> Left, 

 ViewPoint -> {5.45684, -8.27273, 3.12809}]
Out[2]=