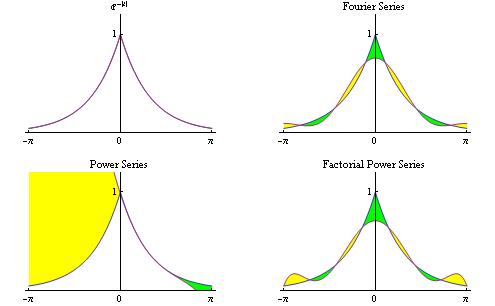
GraphicsGrid[

 Partition[

  Table[Plot[{Exp[-Abs[t]], Last[f]}, {t, -\[Pi], \[Pi]},

    PlotRange -> {All, {0, 1.2}},

    Filling -> {1 -> {{2}, {Yellow, Green}}},

    Ticks -> {{-\[Pi], 0, \[Pi]}, {0, 1}},

    PlotLabel ->

     First[f]], {f, {{Exp[-Abs[t]], Exp[-Abs[t]]}, {"Fourier Series",

      fourier}, {"Power Series", power}, {"Factorial Power Series",

      fpower}}}], 2]]


