New in Wolfram Mathematica 7: Statistical Model Analysis  previous | next 
Visualize Confidence Bands for a Nonlinear Model
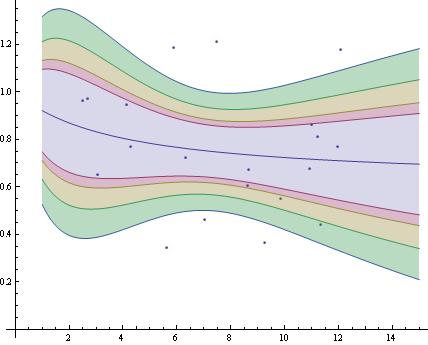
Visualize a fitted nonlinear model along with the data and 90%, 95%, 99% and 99.9% mean prediction confidence bands.
In[1]:=

Click for copyable input
data = BlockRandom[SeedRandom[12345]; 

   Table[{x, 

     Exp[-2.3 x/(11 + .4 x + x^2)] + RandomReal[{-.5, .5}]}, {x, 

     RandomReal[{1, 15}, 20]}]];
In[2]:=

Click for copyable input
nlm = NonlinearModelFit[data, Exp[a x/(b + c x)], {a, b, c}, x];

{bands90[x_], bands95[x_], bands99[x_], bands999[x_]} = 

  Table[nlm["MeanPredictionBands", 

    ConfidenceLevel -> cl], {cl, {.9, .95, .99, .999}}];

Show[ListPlot[data], 

 Plot[{nlm[x], bands90[x], bands95[x], bands99[x], bands999[x]}, {x, 

   1, 15}, Filling -> {2 -> {1}, 3 -> {2}, 4 -> {3}, 5 -> {4}}], 

 AspectRatio -> 4/5]
Out[2]=